July 4th, 2024
7 Best Data Analytics Tools
By Zach Fickenworth · 14 min read

Overview
Choosing the right data analysis tool is key for making sense of your data and making informed decisions. This guide looks at several top options, highlighting their unique features and how they can fit into your work. Whether you need simple visualizations or complex models, we'll help you find the tool that best meets your needs.
The Tools
1. Tableau
2. Julius AI
3. Draxlr
4. Microsoft Power BI
5. R Studio
6. Knime
7. Jupyter
What criteria should you consider when choosing a data analytics tool?
In the dynamic landscape of business intelligence, choosing the right data analytics tool is paramount for harnessing the full potential of your data. This decision influences not only how data is analyzed and interpreted but also how it can drive strategic decisions and innovation within your organization. Here are three critical considerations to guide you in selecting a data analytics tool that is robust, user-friendly, and future-proof, setting the stage for data-driven success.
1. Data Integration and Accessibility
A cornerstone for any effective data analytics tool is its ability to seamlessly integrate with diverse data sources and formats. It should provide easy access to data, regardless of where it's stored or how it's structured. The ideal tool breaks down data silos, enabling users to pull information from various sources into a cohesive, accessible format. This foundation ensures that businesses can leverage all their data, not just fragments, for comprehensive analysis.
2. User Experience and Flexibility
The effectiveness of a data analytics tool is also measured by how easily individuals across the organization can use it. This includes intuitive interfaces for non-technical users and flexible, powerful features for data scientists. A tool that balances simplicity with depth allows businesses to democratize data analytics, empowering more decision-makers to rely on data-driven insights without the constant need for IT or data expert intervention.
3. Scalability and Future-Proofing
Lastly, considering the rapid pace of data generation and technological advancement, a data analytics tool must not only handle today's data volumes and complexity but also adapt to future demands. This entails scalability in handling growing data, as well as incorporating emerging technologies like AI and machine learning for predictive analytics and automated insights. A future-proof tool evolves with your business, ensuring long-term value and support for emerging data analytics trends and methodologies.
Focusing on these principles—integration and accessibility, user experience and flexibility, and scalability and future-proofing—ensures that the selected data analytics tool can meet both current and future needs, fostering a data-driven culture within the organization.
The Tools
Tableau: Best for Interactive Data Visualizations
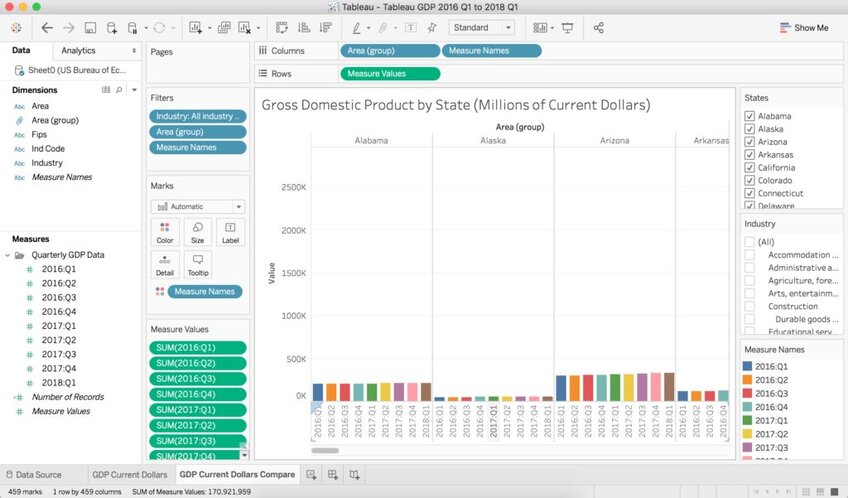
Tableau transforms the way data-driven professionals understand and interact with their data, offering an intuitive platform for creating dynamic, interactive visualizations. With drag-and-drop functionality, Tableau enables users to craft complex charts and dashboards that communicate insights vividly, without the need for deep technical expertise. Ideal for those aiming to bring their data stories to life, Tableau supports real-time data updates, allowing decisions to be made based on the very latest information. Whether it’s exploring patterns in customer behavior or tracking operational efficiency, Tableau serves as a powerful tool in making data accessible and actionable across any organization.
Julius: Best for Exploratory Data Analysis (EDA)
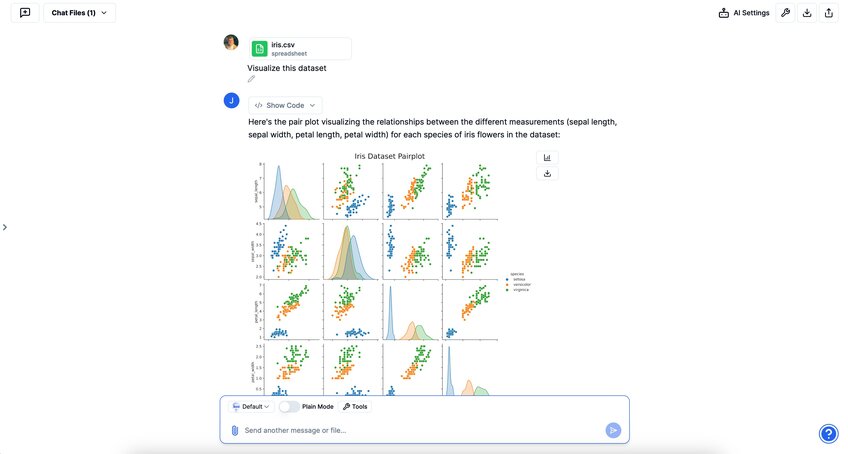
Julius offers a clean AI workspace for data analysts seeking to use Python to perform analysis, train models, and generate clean visualizations. Users simply provide instructions in everyday language, and Julius translates these into the requisite Python code, eliminating the need for extensive programming knowledge (although you maintain the ability to edit the generated code). Whether you’re looking to quickly slice & aggregate product data, forecast sales using an ARIMA model, or visualize retention for a presentation, Julius is a one-stop solution which has the potential to replace a plethora of existing tools in your stack.
Draxlr: Best for AI-Powered SQL Query Generation

Draxlr offers a quick, no-hassle setup process that gets you analyzing data in minutes — no IT team required. Whether you’re using SQL databases, third-party applications, or Excel files, Draxlr is designed to handle it all with flexibility, offering both cloud-based and on-premise solutions to suit your needs. Its powerful no-code query builder makes it easy for non-technical users to run ad-hoc queries, create custom columns, and interact with data without writing a single line of code. It has advanced features like Generate SQL with Draxlr AI, drill-down which provides row-level details, Real-time Slack and email alerts, Live mode, Embed to any application, and more. Lastly, with fast and responsive support, Draxlr ensures smooth data handling at every step.
Microsoft Power BI: Best for Comprehensive Business Intelligence
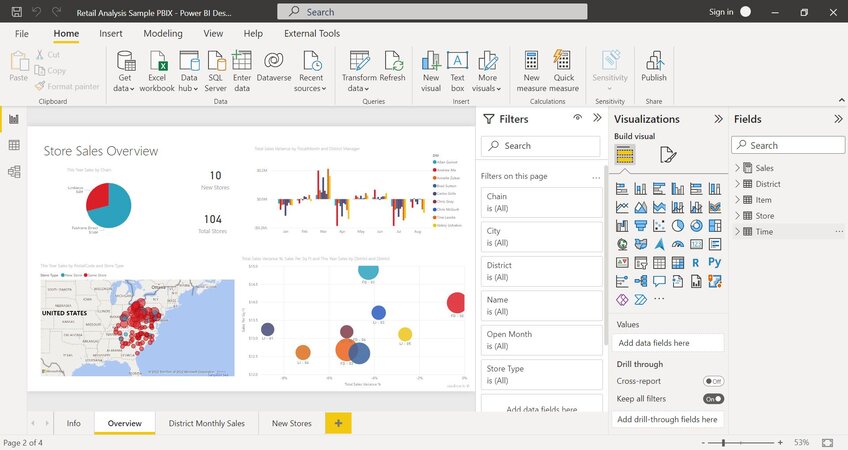
Microsoft Power BI stands out for its deep integration with existing Microsoft products and its comprehensive business intelligence capabilities. Users can easily aggregate, analyze, and visualize data from diverse sources, turning it into actionable insights with just a few clicks. Power BI’s robust set of tools caters to both beginners and advanced users, facilitating complex data modeling, real-time analytics, and AI-enhanced insights. For organizations embedded in the Microsoft ecosystem looking for an extensive, cost-effective analytics solution, Power BI represents an optimal choice.
R Studio: Best for Statistical Computing
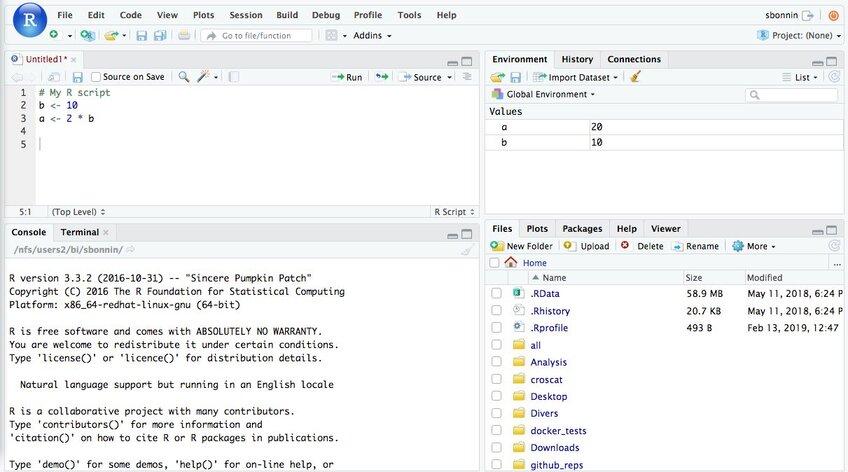
R Studio elevates the power of R, a language designed for statistical analysis and graphical interpretations. It provides an accessible environment for data analysis, allowing researchers, statisticians, and data scientists to write R scripts more efficiently. With R Studio, users can execute data manipulation, perform statistical modeling, and create high-quality graphs that unveil hidden insights within the data. Ideal for academic research and scientific exploration, R Studio supports a wide range of statistical techniques, making it a preferred tool for in-depth data investigation.
Knime: Best for Workflow Automation
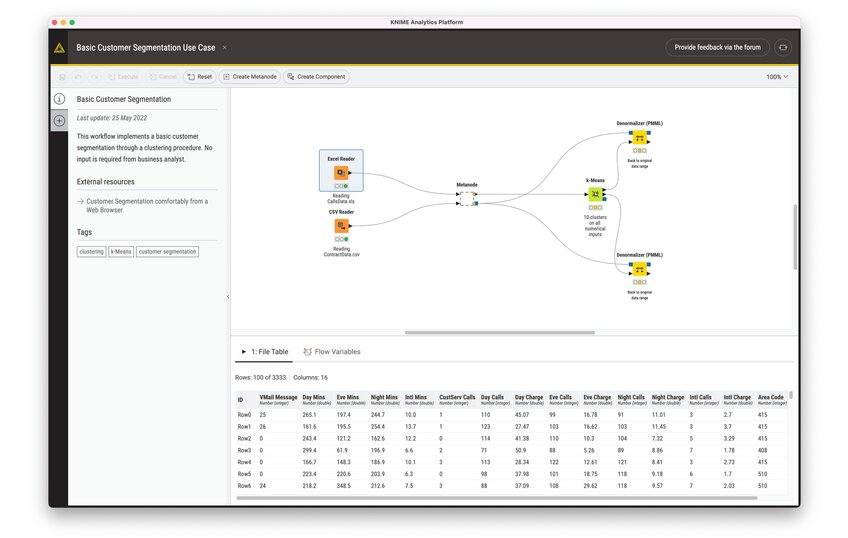
Knime stands as a leader in workflow automation, enabling users to design data science processes from data preparation to analysis and reporting, all within a no-code or low-code environment. Its visual programming interface allows for the seamless creation and execution of data flows, integrating various components for machine learning, data mining, and complex statistical analysis. For analysts seeking to streamline their data processes and automate repetitive tasks, Knime offers a flexible, scalable solution that accelerates the journey from raw data to meaningful insights.
Jupyter Notebook: Best for Standard Data Science
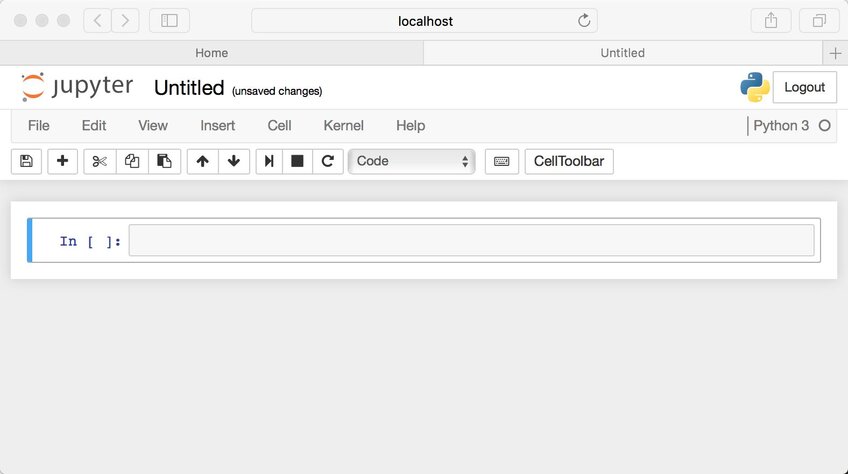
Jupyter Notebook is an open-source tool that has revolutionized collaborative data science work. It allows users to create and share documents that contain live code, equations, visualizations, and narrative text. Ideal for exploratory data analysis, machine learning, and educational purposes, Jupyter supports over 40 programming languages, including Python, R, and Julia. Its interactive environment facilitates the sharing of insights and methodologies within the data science community, making it a staple for researchers and educators alike. Whether you’re documenting your latest findings or teaching complex data science concepts, Jupyter provides a versatile platform for interactive, collaborative exploration.
Conclusion
In the evolving landscape of data analysis, the choice of the right tool can significantly influence the efficiency, depth, and clarity of insights derived from your data. From the intuitive AI-driven capabilities of Julius to the diverse functionalities offered by Tableau, Looker, Microsoft Power BI, R Studio, Knime, and Jupyter, each platform brings unique strengths to the table. Whether your priority lies in seamless Python integration, advanced visualizations, collaborative features, or comprehensive data modeling, there's a solution tailored to meet your needs. As we embrace these innovative tools, the opportunity to unlock deeper insights, forecast trends with greater accuracy, and present data in compelling new ways is at our fingertips.
Frequently Asked Questions (FAQs)
Excel is a versatile tool for basic data analysis, offering features like pivot tables, charts, and built-in statistical functions. It’s particularly effective for small datasets and straightforward tasks, making it a go-to option for beginners and non-technical users.
While Excel is great for simple tasks, it struggles with large datasets, advanced analytics, and collaborative workflows. Its lack of automation, limited scalability, and higher risk of human error make it less suitable for complex data analysis compared to more robust tools like Tableau, Power BI, or Julius AI.
