Loved by 2,000,000+ users and trusted by individuals at


Featured in


Save time. Make Julius do your data work.
Turn hours of Excel into minutes on Julius.
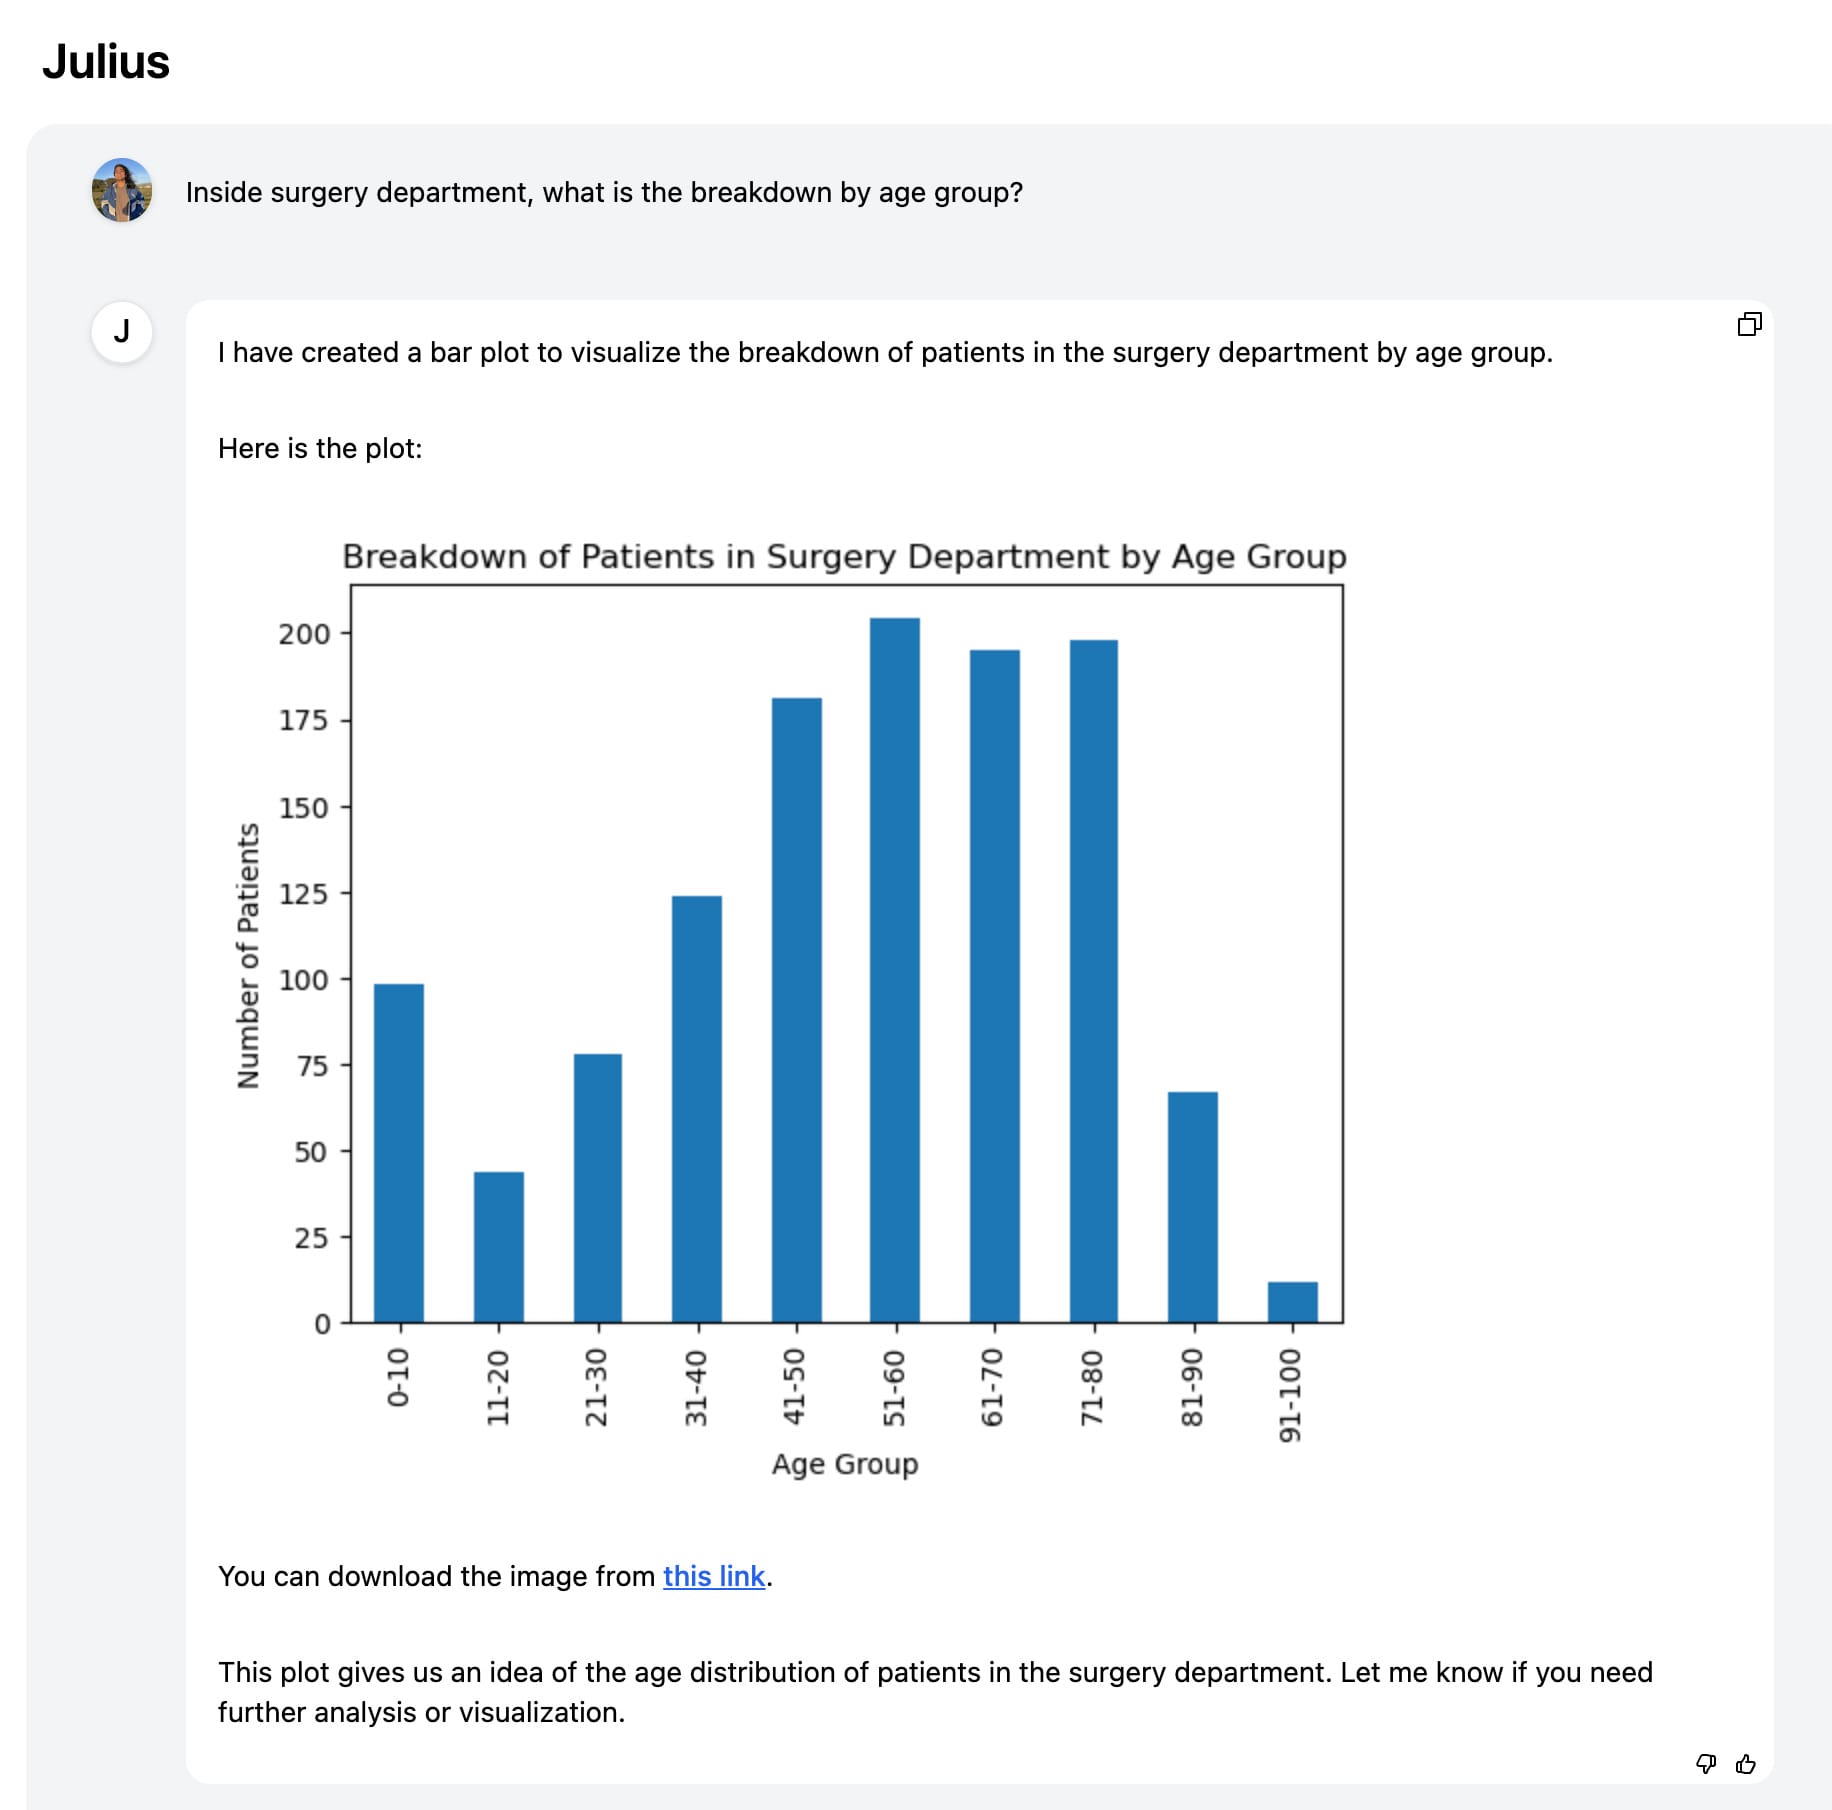
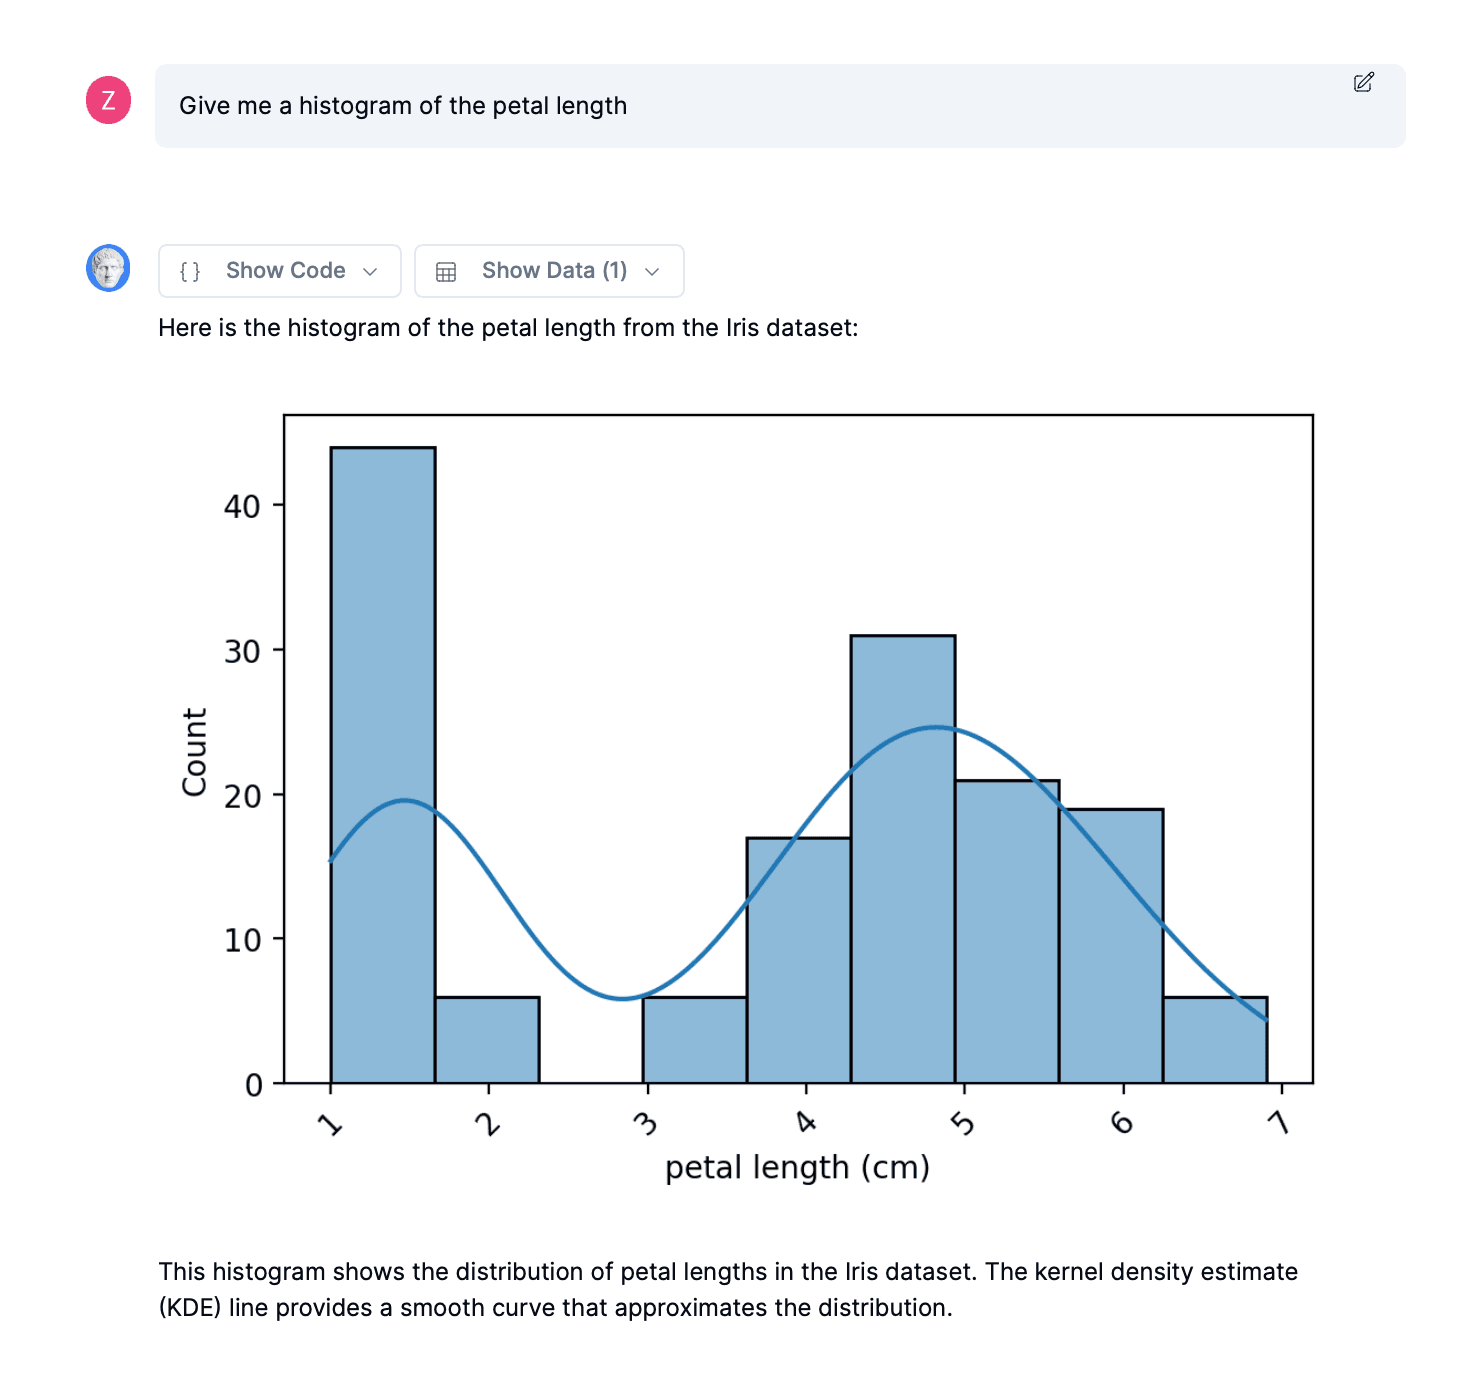
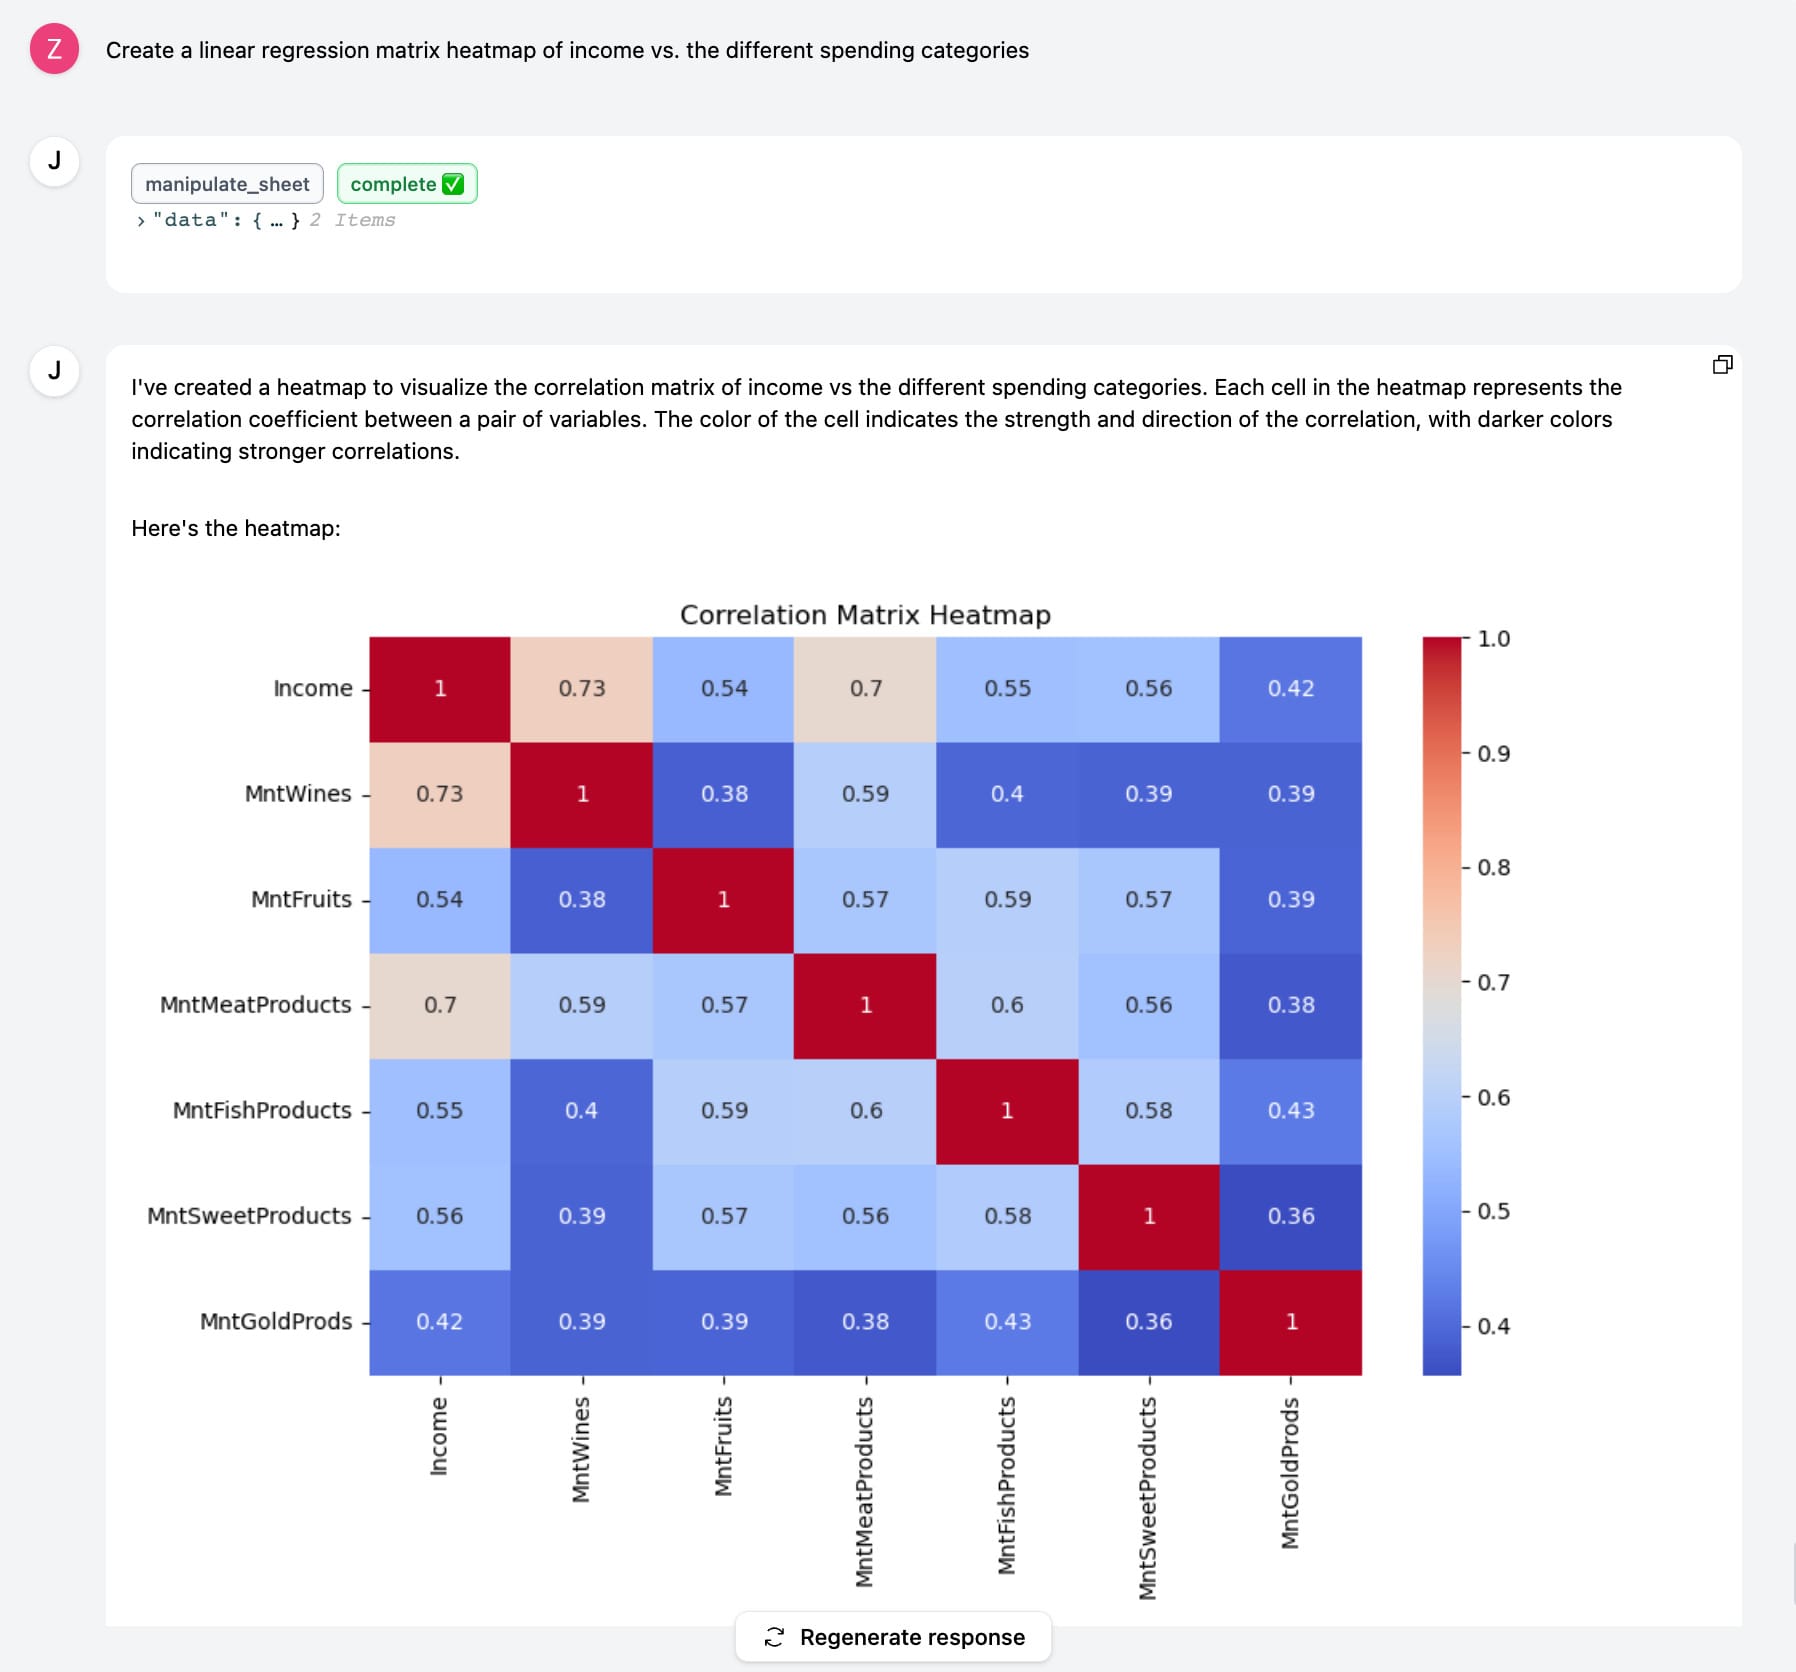
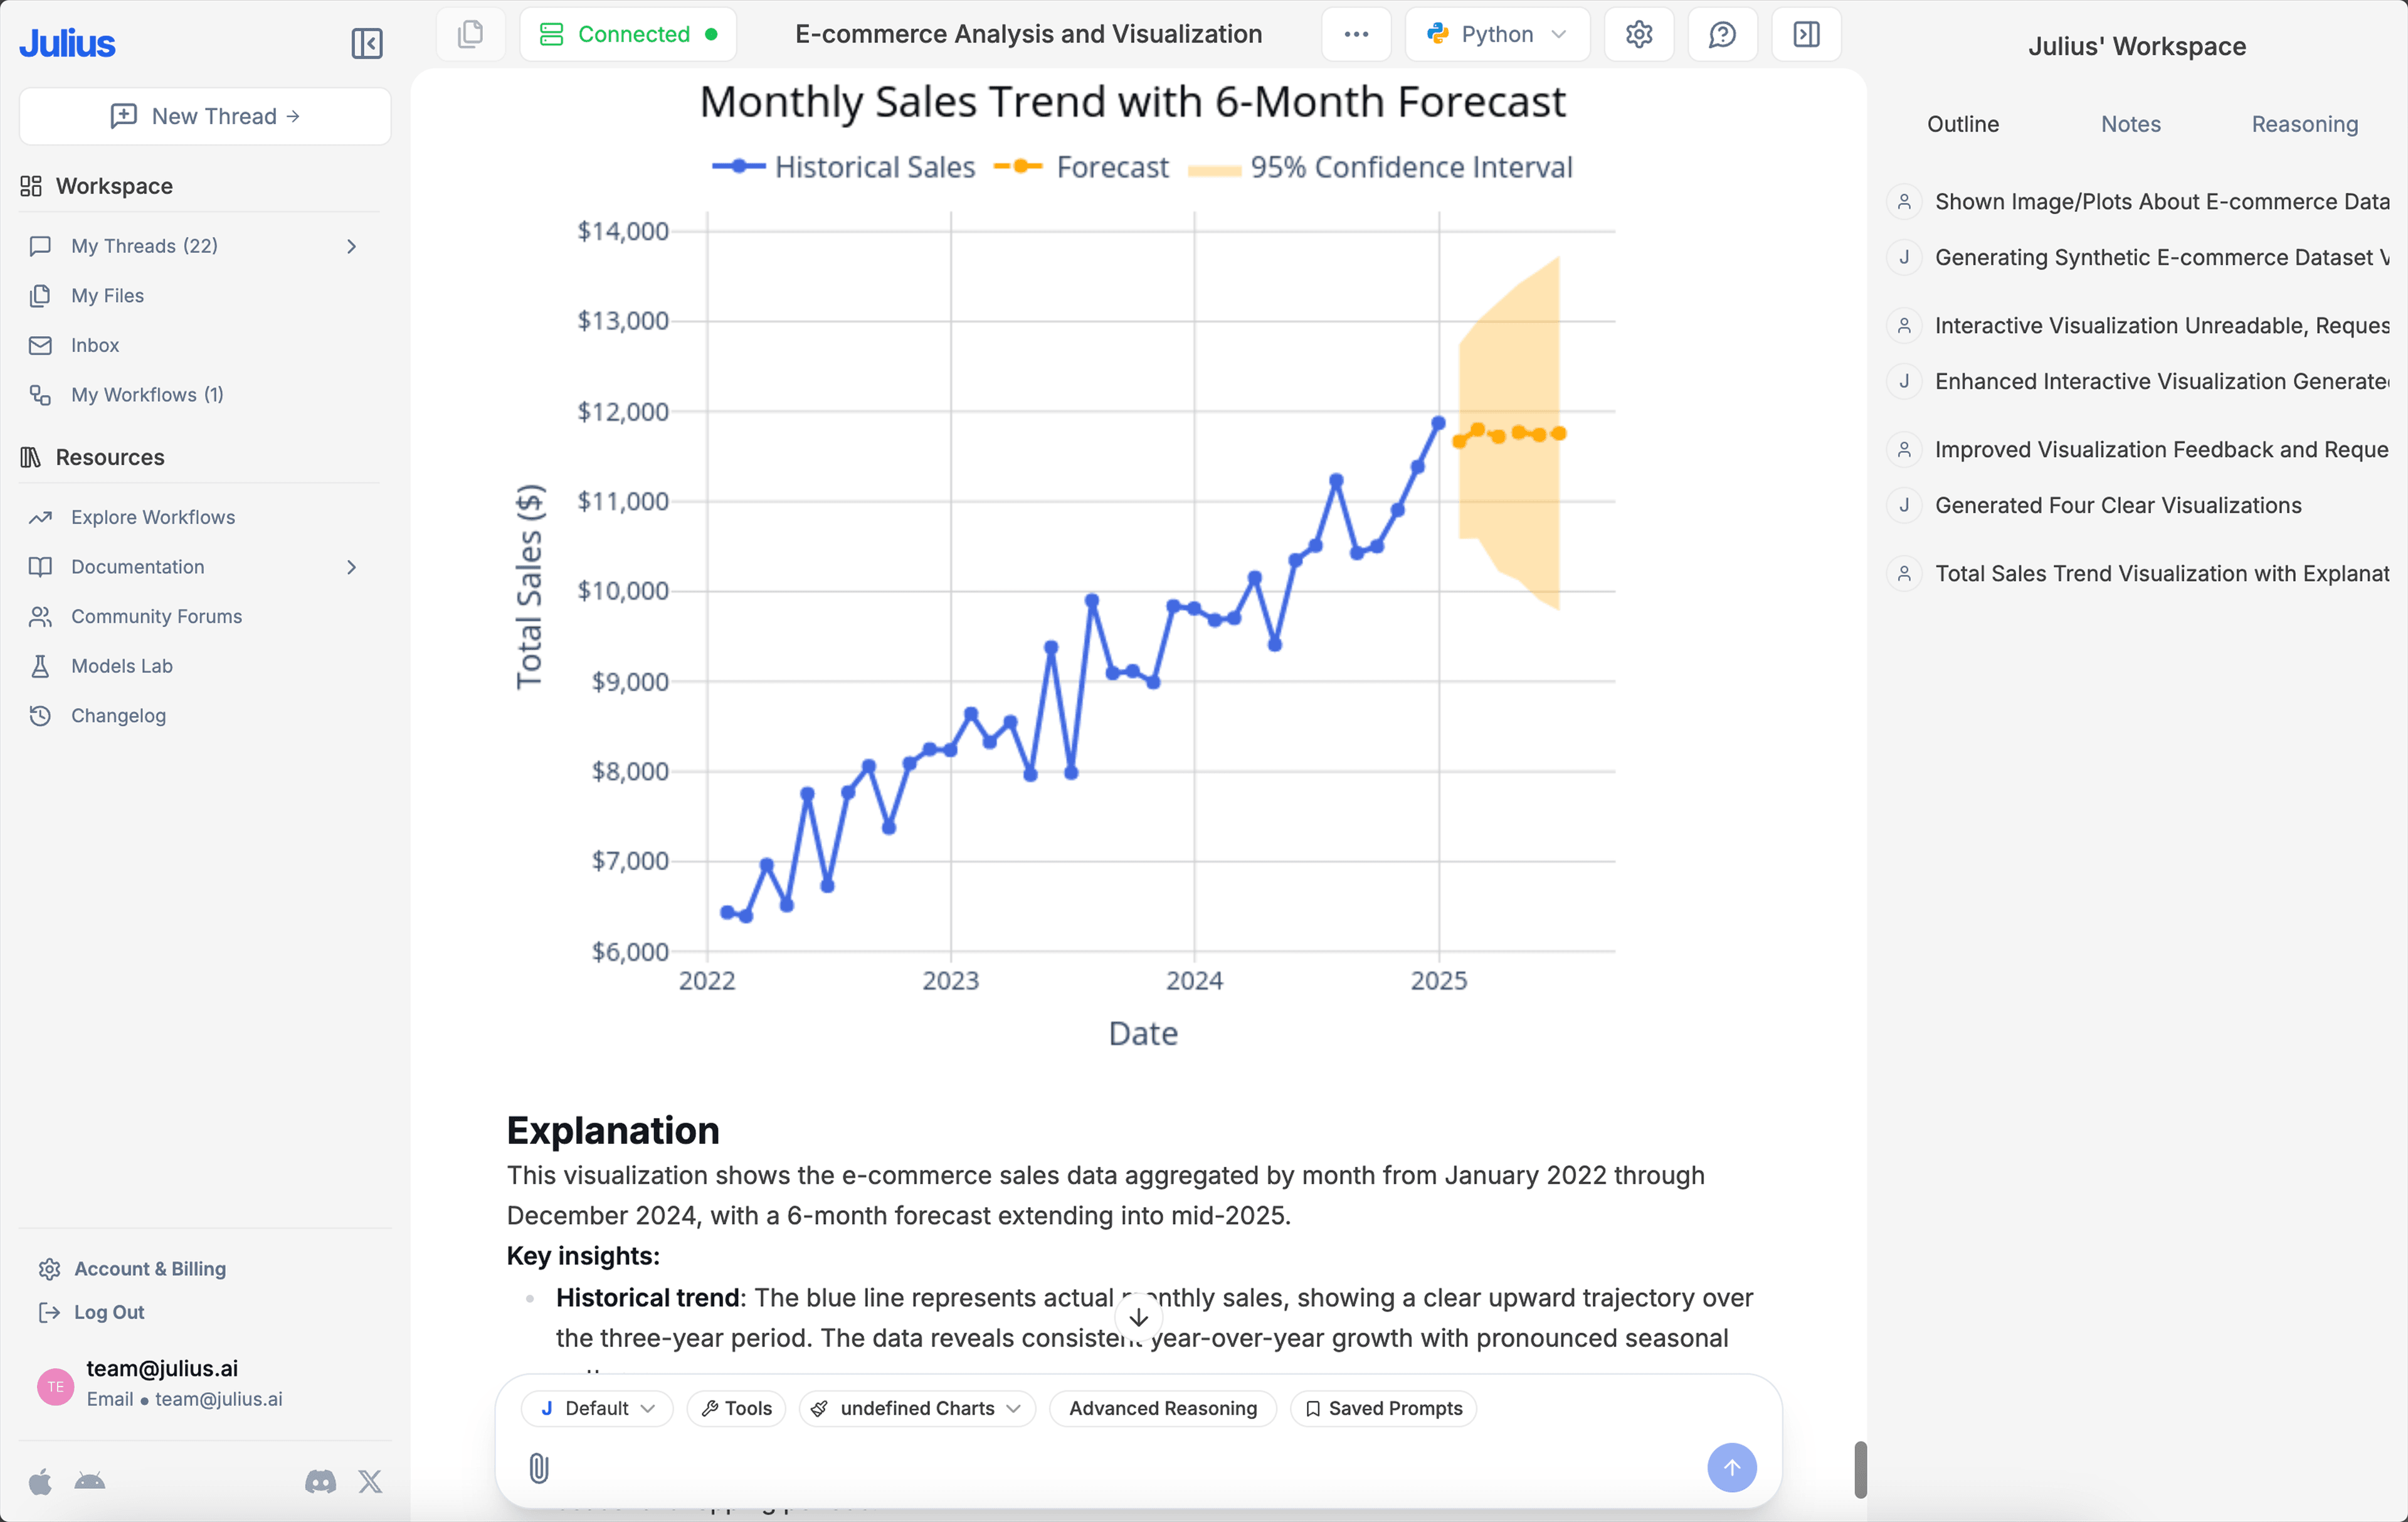
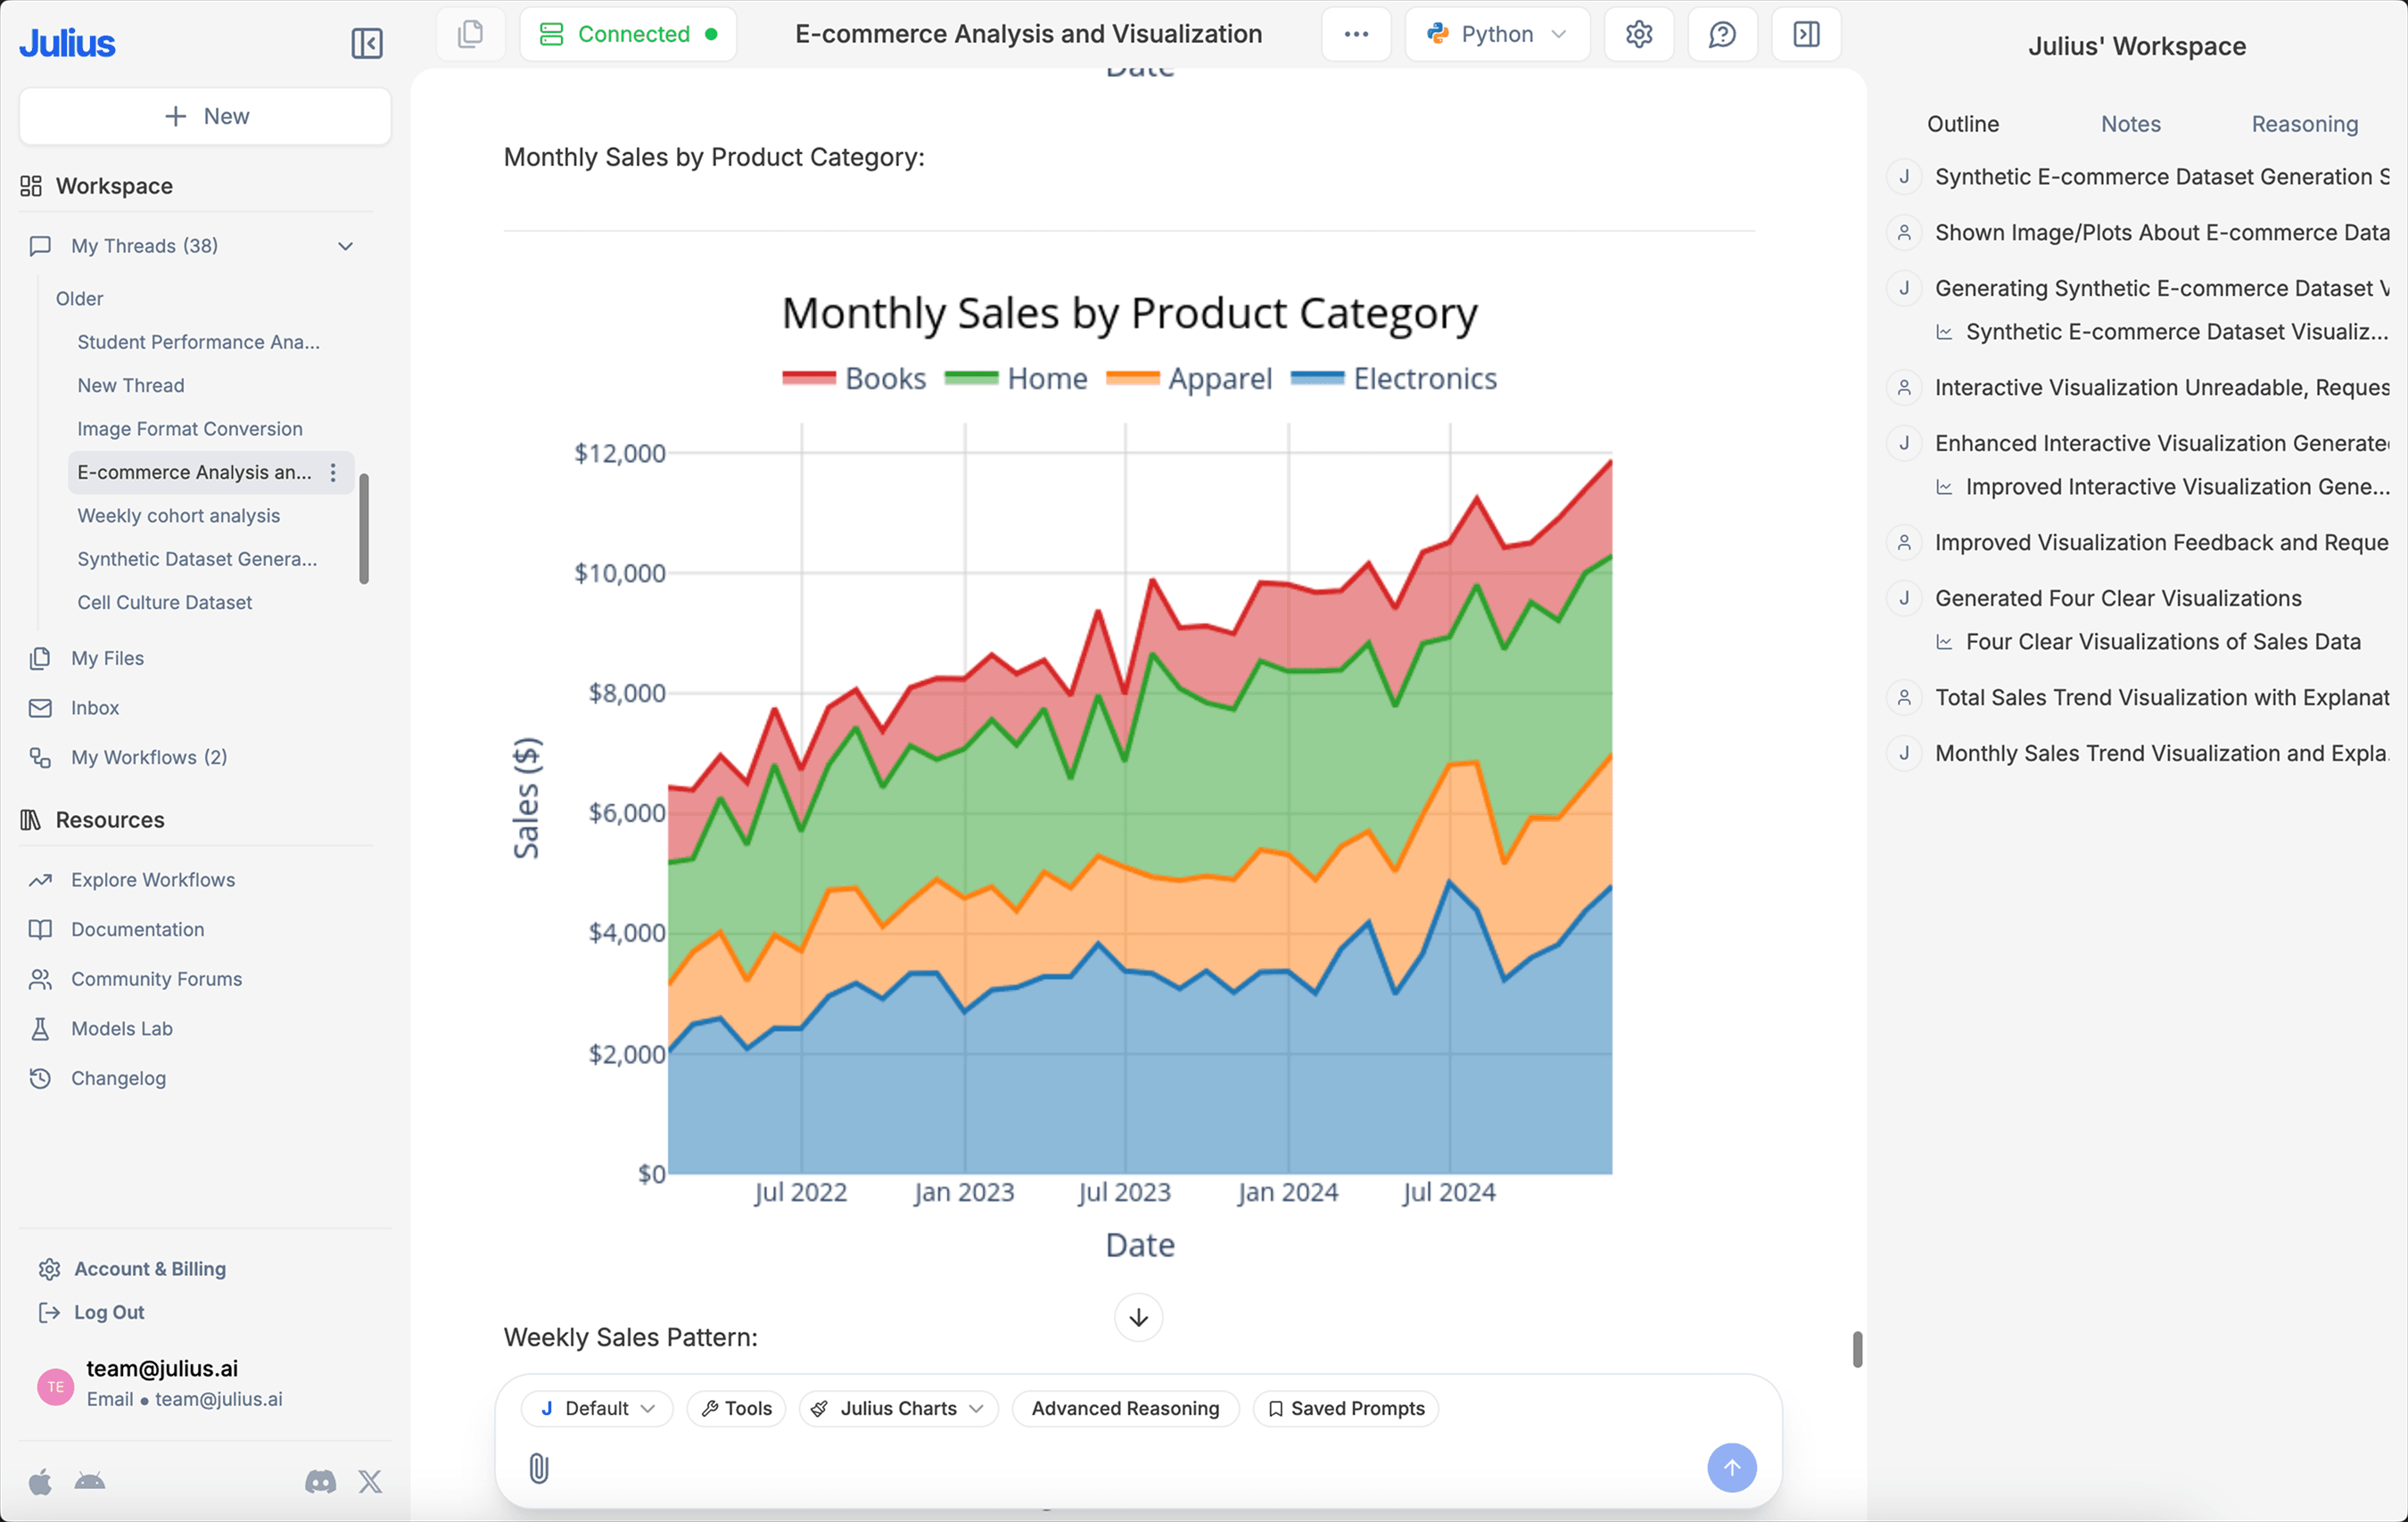
Generate sleek visualizations
Communicate findings with confidence.
Ask data questions
Get answers to your queries in seconds.
Cleaning made effortless
Automate data prep and focus on what matters.
Export instantly
Quickly download data into CSV or Excel for easy sharing.
Create captivating animations
Bring data to life with dynamic GIFs.
Unlock statistical modeling
Get expert-level insights without the complexity.
Frequently asked questions
How do I link a data source?
You can link a data source on the Files page or directly in our Chat interface. For more detailed instructions on linking a data source, check out our Julius Start Guide.
What do I do after linking a data source?
What data sources are supported?
We currently support any data file format, including but not limited to spreadsheets (.xls, .xlsx, .csv), Google Sheets, images (.jpeg, .png), PDFs, and text-based files (.docx, .txt). If you have a different file format, odds are we support it — go ahead and try to upload it within our Chat.
Can I analyze spreadsheets with multiple tabs?
Yes! Upload your multi-tab spreadsheet as you would any other file. Once uploaded, you can refer to the individual names of the tabs in your prompts, and Julius will perform analysis on those tabs accordingly.
Can I generate data visualizations?
Yes, it's very easy to generate clean-looking data visualizations using Julius. Once you have uploaded your data, simply prompt the AI to create a chart or graph.
Is there a discount for students, professors, or teachers?
Yes! We offer a 50% discount to students and other members of academia. Just sign up, shoot us a quick email at team@julius.ai letting us know you're a student before subscribing, and we'll let you know how to apply the 50% discount to your account.
What is Julius’ data privacy policy?
We utilize strict access-control, as each user only has access to their own data in the secure notebook file storage — even our python code execution environments are sandboxed by user. In addition, your data is completely erased from the servers whenever you delete it within the app. You can read further into our data policies here.
Is this free?
Yes! By default all users can send up to 15 messages a month with our most advanced AI model. Once you hit the monthly limit, you can upgrade your plan in your Account page.