August 2nd, 2024
What Is Correlation Analysis? Definition, Examples, & More
By Connor Martin · 10 min read
Collecting. Organizing. Analyzing. Interpreting. Presenting. Those are the key steps in statistical analysis. However, each of these steps might differ depending on the specific objectives (and complexity) of the analysis being conducted.
With correlation analysis, the emphasis is on assessing whether two (or more) variables are related and, if so, how strongly. Though this statistical method is employed rather frequently, it’s still often misinterpreted.
With this in mind, let’s set the record straight and clarify the process, purpose, and applications of correlation analysis in statistics.
Defining Correlation Analysis in Statistics
As previously mentioned, correlation analysis is used to measure and describe the strength of the relationship between two variables. That is, of course, after determining whether the said linear relationship even exists.
What correlation analysis doesn’t do, however, is make any statements about cause and effect between the two variables. Its purpose is simply to gauge the level of change in one variable associated with changes in another variable (without implying causation).
In this sense, there can be three possible results of correlation analysis.
1. No correlation
2. Positive correlation. With two positively correlated variables, when one variable increases, the other does, too.
3. Negative correlation. When one variable increases, the other variable decreases proportionally.
Why Is Correlation Analysis Helpful?
Due to its nature, correlation analysis serves as an excellent starting point for any research. From there, it can help researchers easily spot trends, make predictions, and identify patterns.
But that’s not all. These insights aren’t drawn just for the sake of research. Their goal is to fuel the single most important aspect of decision-making – informed choice.
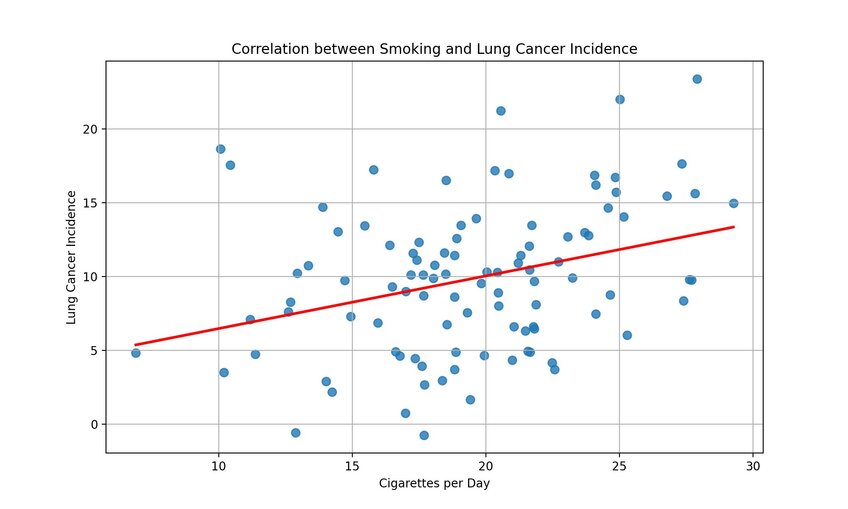
Let’s take healthcare as an example. Determining a negative correlation between higher physical activity levels and lower heart rate disease risk scores can prompt healthcare providers to emphasize exercise in preventative care programs. Similarly, identifying a positive correlation between smoking and lung cancer risk can lead public health officials to prioritize anti-smoking campaigns and policies.

How to Measure Correlation
This guide has already mentioned the three possible outcomes of the correlation analysis. But how do you actually come to this conclusion? In other words, how do you measure the correlation between two variables? Here’s a brief step-by-step guide to answer this question.
Step 1 - Write a Survey
Naturally, the first step is to collect the necessary data for the two variables of interest. Let’s say you’re conducting market research on customer satisfaction and product reviews. The process of gathering data would start with designing a survey to collect responses and determine the necessary strength scores.
Step 2 - Program the Survey
For Step 2, you’ll need to use a program to test out the survey and ensure all the questions function as intended. Why? Because you can’t allow any technical issues or mislabeled scales to compromise the validity of data. If you do so, your data will be tainted and, thus, unusable.
Step 3 - Clean the Data
After reaching the target number of responses to your survey, you’ve officially collected the necessary data. Congratulations! But be careful. It’s still not time for the analysis. You must first clean the data, i.e., identify and correct errors, remove duplicates, handle missing values, and ensure consistency in formatting. Only then can you rest assured the integrity of your data is protected.
Step 4 - Analyze the Relationships Between the Two Variables
This is where the correlation analysis actually takes place. How? By employing the Pearson correlation coefficient and the Spearman rank correlation methods. Learn more about these methods in the next section.
Coefficients to Use for Correlation
Pearson’s correlation coefficient and Spearman’s rank correlation coefficient aren’t the only correlation coefficients to be used for correlation analysis. However, they are the most common ones. Here’s a brief overview of how each correlation coefficient works and when to use it.
Pearson Correlation Coefficient
The Pearson correlation coefficient, labeled as an “r,” is the most widely used correlation coefficient and the one researchers typically try out first. This correlation coefficient measures the linear relationship between two continuous variables that are also normally distributed.
The correlation coefficient calculated using this method will be a numerical value between -1 and +1 (as it always happens in correlation analysis). The -1 value indicates a perfect negative linear relationship, while the +1 value means a perfect positive relationship. The value of 0 means, of course, that no correlation exists.
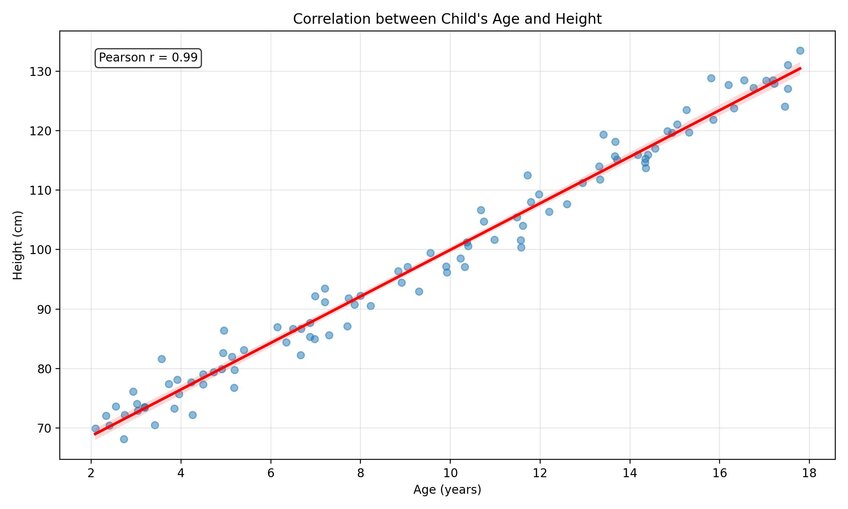
An example of a linear correlation between two variables is a child’s height increasing with age.

Spearman Rank Coefficient
Does your data display a non-linear relationship? If so, Spearman’s rank correlation coefficient is the way to go. This correlation coefficient, denoted with a “ρ,” assesses how well the relationship between two variables can be described using a monotonic function.
A monotonic function is one that either never decreases or never increases as its variable increases. This means that the direction of the relationship between the two variables is consistent but not necessarily linear. A good example of this kind of relationship is students’ ranks in different subjects.
How to Interpret Correlation Analysis
This guide has already discussed what the values of “-1,” “0,” and “1” mean. But these values are the so-called perfect values. The rest of the received values can be interpreted as follows:
- - 0.00—0.29: Weak relationship
- - 0.30—0.49: Moderate relationship
- - 0.50—0.79: Strong relationships
Anything above 0.79 is considered a perfect relationship.
Correlation Analysis Practical Examples
By now, you’ve already learned some practical examples of correlation analysis. Here are a few more to illustrate its wide-ranging applications:
Make the Most of Correlation Analysis with Julius AI
Correlation analysis can be tricky to perform, especially if you lack the time, experience, or skills to ensure an accurate interpretation of data. If this is the case, you can always outsource this task to your personal data analyst – the AI-powered Julius AI. You only need to input your data, and Julius AI will take care of the rest. Achieve maximum efficiency without the data-crunching headache.
Frequently Asked Questions (FAQs)
What is the best way to measure correlation?
The best way to measure correlation depends on the type of data and relationship. For linear relationships between continuous and normally distributed variables, the Pearson correlation coefficient is ideal. For non-linear or ranked data, the Spearman rank correlation coefficient works best.
Is correlation analysis qualitative or quantitative?
Correlation analysis is a quantitative statistical method. It focuses on numerically assessing the strength and direction of the relationship between variables, rather than exploring subjective or descriptive aspects typical of qualitative research.
How to report correlation analysis?
When reporting correlation analysis, include the correlation coefficient value, the p-value for statistical significance, and the direction of the relationship (positive or negative). For example: "A Pearson correlation coefficient of 0.65 (p < 0.05) indicates a strong positive correlation between advertising spend and sales revenue."
