July 7th, 2024
Top 8 Benefits of Data Visualization
By Alex Kuo · 11 min read
Big data and data analysis projects are becoming increasingly important. As a result, data visualization is more important than ever. After all, how can we even begin to understand (and derive valuable insights from) such vast amounts of data without finding a way to present it in a more accessible manner?
But simply making that raw data more visually appealing is far from the only benefit of visualizing data. There’s a whole host of benefits of data visualization, which explains why data scientists and analysts place such a strong emphasis on it.
What Is Data Visualization?
Though its name is self-explanatory, let’s cover all the bases before diving into the benefits of data visualization.
Data visualizations are visual representations of data and information. With the help of visual elements like charts, graphs, and maps (and some handy data visualization tools), even the most complex data can be presented in a clear, concise, and easily understandable way.

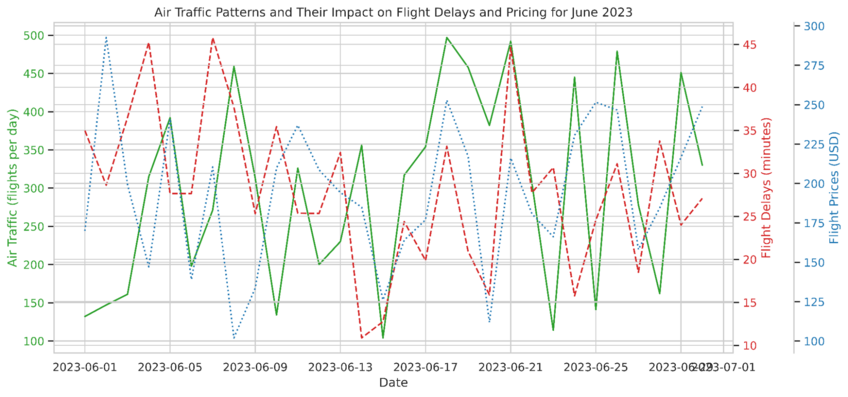
Example chart displaying the number of flights per day, average flight delays, and average flight prices. Created with Julius AI
8 Data Visualization Benefits to Know of (and Utilize) in 2024
Here are the top eight benefits of effective data visualization that can help individuals (and organizations) make better decisions, understand their data, and communicate more effectively.
#1 Simplifying Complex Data
Though it’s already been said, this benefit is far too important not to have its own section. In fact, it’s arguably the No. 1 benefit of data visualization.
Of course, we’re talking about simplifying complex data sets.
Once data is presented in such an accessible manner, all the crucial data insights follow suit.
#2 Revealing Patterns and Trends
Though presenting data in a more understandable and visually appealing manner is a benefit in and of itself, it’s just the beginning. Data visualization goes beyond aesthetics to reveal patterns and trends that might otherwise go unnoticed in data’s raw, numerical form.
But why does the ability to identify trends and patterns faster matter?
It matters because it leads to better and quicker decision-making. Identify patterns and trends straight away, and you’ll save valuable time and resources and account for all the insights traditional reports miss. This also means you’ll be able to respond to new business opportunities (and challenges) more effectively.
#3 Unlocking Key Values
Data visualization enables you to quickly gain valuable insights into various business aspects. The organization’s performance, customer behavior, competitive landscape, and market trends are just some of them. But not all insights are equally important or relevant to the organization’s objectives.
Good news – with effective data visualization, the key values you’re looking for will be front and center. Better yet, everyone in the organization will be able to understand and interpret them.
#4 Improving Engagement
There’s nothing engaging or appealing about heaps of unsightly data. There is, however, something truly captivating about a well-crafted data visualization.
When data is presented visually, it’s more likely to grab (and hold) the viewer’s attention, be processed faster, and be easier to remember. However, “well-crafted” is the key word here.
If you want your visualizations to truly engage the audience and include some unique features, it might be best to make them using reliable data visualization tools.
#5 Increasing Accessibility
Not every employee (or collaborator) is a data expert. However, every single one of them will need data to some extent. That’s why data visualization plays such a crucial role in increasing accessibility to data. When turned into a handy chart or graph, everyone within the team should be able to derive insights from the data they present, be they in sales, marketing, business operations, or the C-suite.

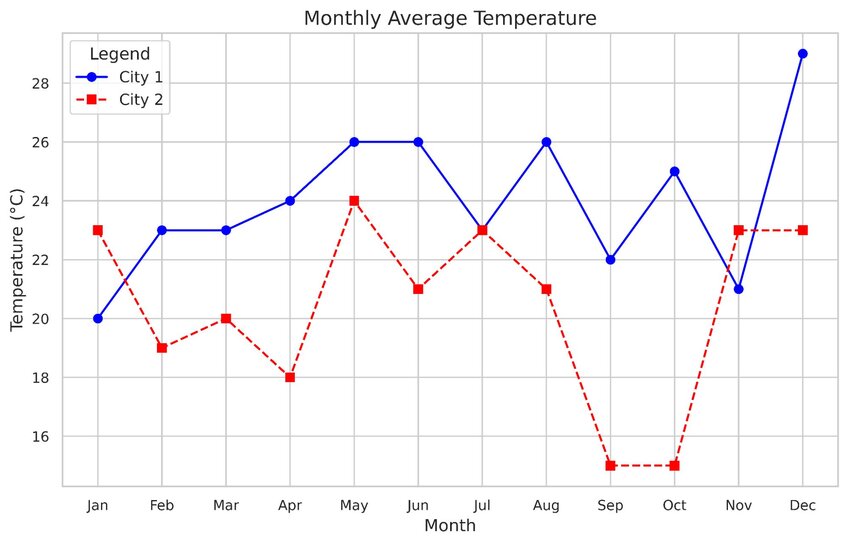
Example of an accessible line chart with features like high contrast colors, clear legend, different line styles, large text, and grid lines. Created with Julius AI
#6 Identifying Areas of Improvement
There’s always room for improvement. But it’s not always easy to identify where those areas are without the right tools. Data visualization (and reliable data visualization software) can help pinpoint these areas by highlighting key metrics and trends.
For instance, let’s say an organization is struggling to retain customers. Through data visualization, this organization can get into the psyche of its target audience, allowing it to quickly grasp its pain points and preferences. The result? Actionable insights that can lead to targeted strategies to improve customer retention.
#7 Enhancing Storytelling
Using data visualization, organizations can transform boring statistics and dry facts into compelling stories. There are numerous data visualization examples that illustrate this concept.
But again, this goes far beyond mere aesthetics.
By creating storytelling visualizations, organizations can make their messages more compelling, impactful, and persuasive. This is especially beneficial when training new employees, convincing stakeholders, and attracting new customers.
#8 Increasing Productivity
Data visualization helps with productivity in several ways.
No. 1 – thanks to immediate insights, teams can act promptly and capitalize on exciting opportunities in real time.
No. 2 – data visualization allows organizations to get ahead of potential blockers and bottlenecks and thus correct them before they can derail or delay any efforts.
And No. 3 – it facilitates better communication and collaboration among team members, even if they are from different departments.
Better productivity results in improved efficiency in decision-making, problem-solving, and project execution. Throw cost savings, increased revenue, and competitive advantage into the mix, and you’ll understand why data visualization is no longer a nice-to-have but a must-have.
Best of all? An AI-powered tool like Julius AI can help you achieve this goal with minimal data visualization skills and with minimal time. Just input your data set and let Julius work its magic.
Discover How Julius AI Can Elevate Your Data Analysis
This guide mentions effective data visualization tools frequently for a reason. You see, these tools are instrumental in creating impactful visualizations that can truly unlock all the benefits of data visualization.
Before you know it, you’ll receive stunning visualizations that not only look good but also effectively convey your data’s key insights.
Sign up for Julius AI today to begin.
Frequently Asked Questions (FAQs)
What are the three main goals of data visualization?
The three main goals of data visualization are to simplify complex data, reveal patterns and trends, and enhance communication of insights. By transforming raw data into accessible visual formats, it helps audiences understand key messages quickly, identify actionable insights, and make informed decisions.
What is the most important aspect of data visualization?
The most important aspect of data visualization is clarity. A well-crafted visualization should convey the data’s message effectively and avoid confusion. This means focusing on clean design, clear labeling, and choosing the right chart type to suit the data and the audience.
What is the proper use of data visualization?
The proper use of data visualization is to translate raw data into meaningful insights through visuals like charts, graphs, or maps. It should highlight important patterns, make data accessible to diverse audiences, and support decision-making, all while avoiding unnecessary complexity or misrepresentation.
