April 2nd, 2024
Explaining the One Sample T-Test
By Alex Kuo · 12 min read

Overview
The world of statistics is vast and filled with numerous techniques that help researchers make sense of data. One such technique, often used but not always fully understood, is the One Sample T-Test. Let's embark on a journey to understand this statistical method in detail.
What is the One Sample T-Test?
The One Sample T-Test is a powerful statistical tool designed to determine if a sample of observations could have originated from a process with a specific mean. Imagine you're overseeing an assembly line that's supposed to produce laptops weighing exactly five pounds. To verify this, you'd pick a sample of laptops, measure their weights, and then use the One Sample T-Test to compare the sample's average weight to the five-pound benchmark.
The Hypotheses Behind the Test
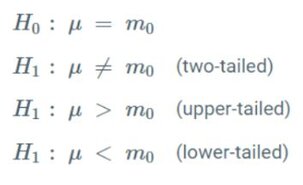
- Null Hypothesis (H0): Assumes no significant difference between the true mean (μ) and the hypothesized value (m0).
- Alternative Hypothesis (H1): Assumes a difference exists between the true mean and the hypothesized value. This can be two-tailed (μ ≠ m0), upper-tailed (μ > m0), or lower-tailed (μ < m0).
The mathematical representations of the null and alternative hypotheses are defined below:

Key Assumptions of the One Sample T-Test
1. The dependent variable should be continuous.
2. Observations should be independent.
3. The data should be approximately normally distributed.
4. The data shouldn't contain outliers.
The Procedure Simplified
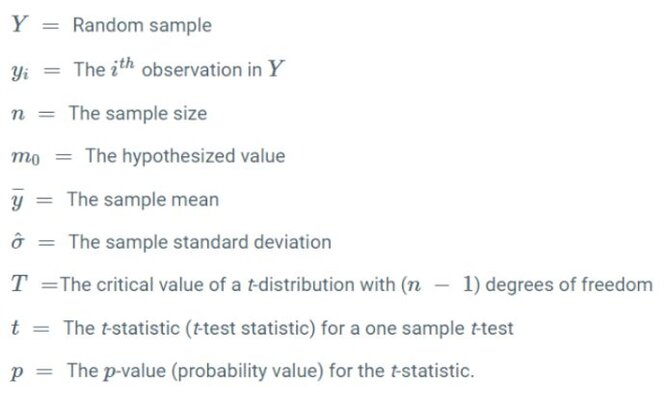
The symbols to be used are defined below:


Interpreting the Results
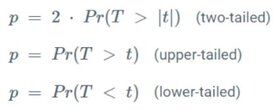
1. Statistical Significance: This is determined by the p-value. A p-value less than 0.05 typically indicates that the results are statistically significant.
2. Practical Significance: This pertains to the real-world implications of the results. A result might be statistically significant, but if it doesn't have a meaningful impact in a practical sense, its significance can be debated.
For instance, in our laptop example, even if we find a statistically significant difference in weights, if the difference is just 0.002 pounds, it might not be practically significant.
Beyond the Basics: Related Analyses
While the One Sample T-Test is a foundational statistical method, there are other related tests and concepts, such as MANOVA and ANCOVA, that researchers can explore to delve deeper into their data.
Conclusion
The One Sample T-Test is a cornerstone in the realm of statistics, offering a systematic way to compare sample data to a specific value. By understanding its hypotheses, assumptions, procedure, and interpretation, researchers and analysts can harness its power to draw meaningful conclusions from their data. Whether you're verifying the weight of laptops or exploring other research questions, this test provides a robust framework to guide your analysis.
As we've delved deep into the mechanics and applications of the one sample t-test, it's evident that having the right tools can make all the difference in analysis. While traditional methods have their merits, why not elevate your statistical journey with Julius.ai? Our platform streamlines complex analyses, ensuring accuracy and efficiency every step of the way. Dive into the future of data analysis with Julius.ai.
