May 8th, 2024
Navigating Through Independent Sample T-Tests
By Alex Kuo · 8 min read

Overview
In the realm of statistical analysis, the Independent Sample T-Test stands as a pivotal tool for comparing the mean values of two distinct groups. This test delves into the influence of an independent variable on the mean score of a dependent variable, providing insights into various fields ranging from medicine to marketing. In this comprehensive guide, we'll explore the nuances of conducting and interpreting an Independent Sample T-Test, and how Julius can assist in this process.
Understanding the Independent Sample T-Test
Applications Across Various Fields
- In medicine, it can compare the quality of life improvements between patients taking different drugs.
- In sociology, it might explore job satisfaction differences between genders.
- In biology, it could compare the size of foxes in different habitats.
- In economics, it's useful for comparing the economic growth of developing nations versus developed ones.
- In marketing, it can analyze spending differences between customer segments.
Conducting the Test in SPSS
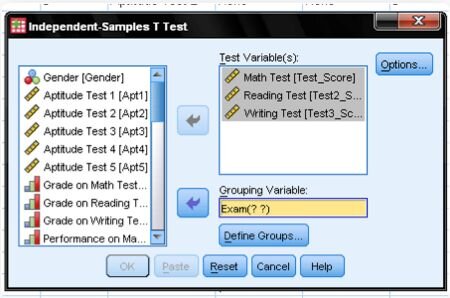
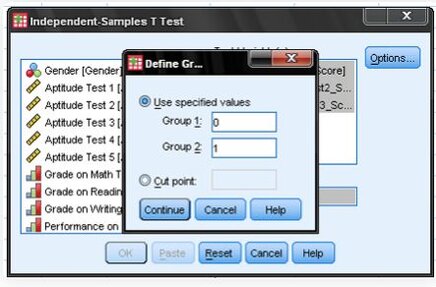
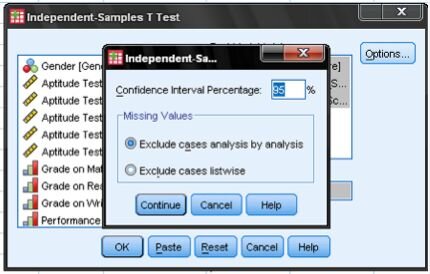
To conduct this test in SPSS statistical software, you would typically navigate to Analyze > Compare Means > Independent Samples T Test. Here's a step-by-step guide:


Interpreting Results
The Independent Sample T-Test is a robust tool for comparing mean scores across different groups. Whether you're a researcher, marketer, or data analyst, understanding how to conduct and interpret this test is crucial. With the assistance of tools like Julius, you can unlock deeper insights and make data-driven decisions with confidence.
Julius can be an invaluable tool in this process. It can help in organizing and analyzing data, ensuring that the assumptions of the test are met, and providing clear visualizations of the results. With Julius, you can streamline the process of conducting and interpreting an Independent Sample T-Test, making your data analysis more efficient and insightful.
