May 9th, 2024
Unveiling the One-Sample T-Test
By Zach Fickenworth · 9 min read

Overview
In the realm of statistical analysis, the one-sample t-test stands as a pivotal tool, particularly when it comes to comparing a single sample mean against a known or hypothesized value. This test is part of the broader t-test family, which is renowned for comparing mean scores in various scenarios. Unlike its counterparts—the independent and dependent-sample t-tests—the one-sample t-test focuses solely on one group, offering unique insights into how it stacks up against a predetermined benchmark.
Understanding the One-Sample T-Test
In contrast, the independent sample t-test compares means of two distinct groups, answering questions like, “Do boys and girls differ in their SAT scores?” The dependent sample t-test, on the other hand, compares matched scores or measurements, such as pre and post scenarios, answering questions like, “Do pupils’ grades improve after receiving tutoring?”
Practical Applications of the One-Sample T-Test
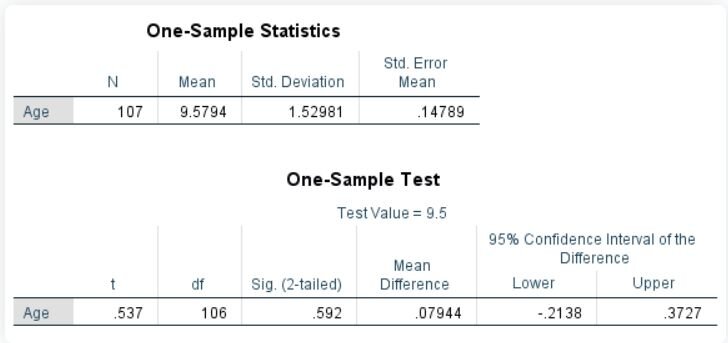
1. Testing Against a Predetermined Value: Researchers might want to test if the average age of retirement in a population is indeed 65. By sampling individuals entering retirement and comparing their retirement age against the value of 65, the one-sample t-test can validate or refute this assumption.
2. Benchmark Testing: Organizations might want to test if their average production time aligns with industry benchmarks. The one-sample t-test can ascertain if there's a significant deviation from these benchmarks.
3. Replication Studies: In cases where an experiment is replicated, the one-sample t-test can compare the results of the replication against the original study's findings to check for consistency.
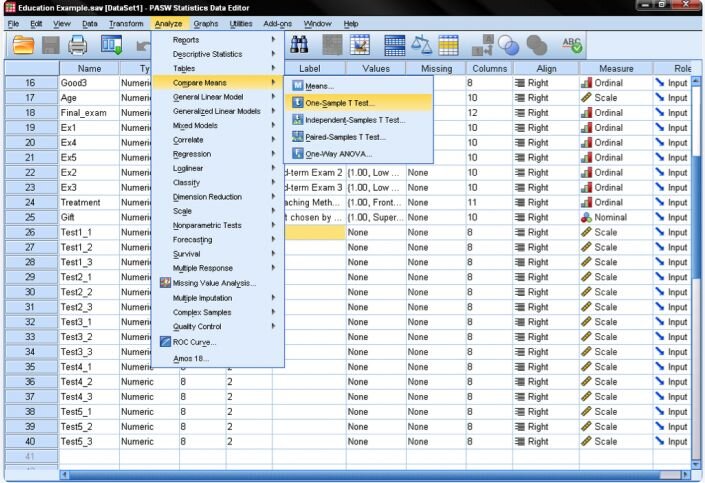
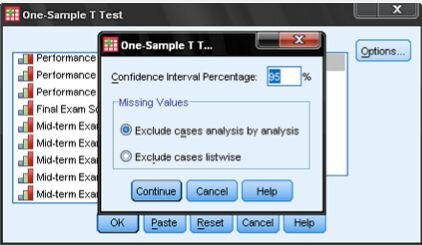
Conducting the One-Sample T-Test in SPSS
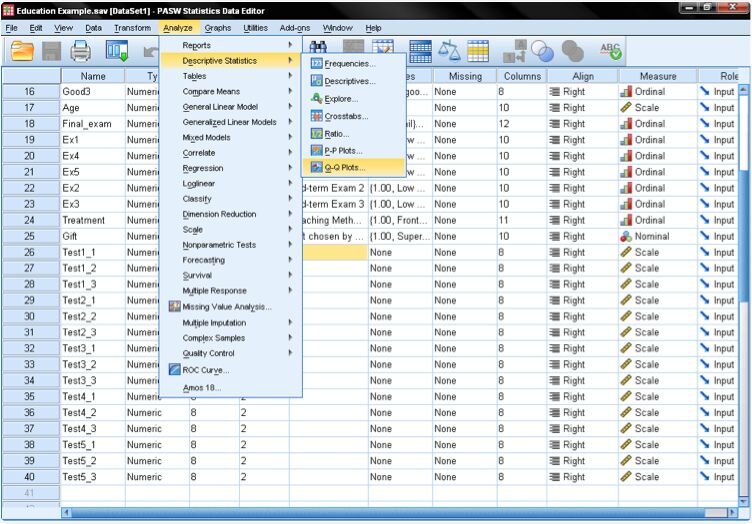
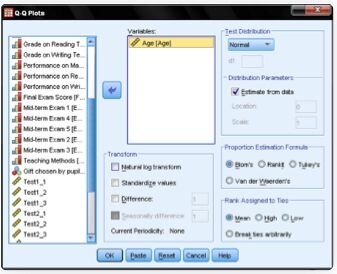
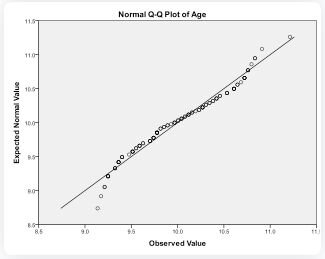
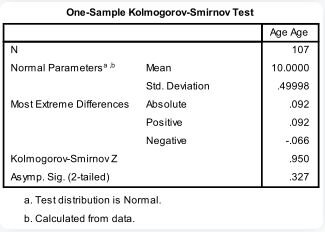
1. Check for Normality: Using a Q-Q Plot and a Kolmogorov-Smirnov test, we first ascertain if the variable (age) is normally distributed.
Conclusion: How Julius Can Assist
The one-sample t-test is a robust tool for comparing a single sample mean against a predetermined value. Its simplicity and precision make it a go-to method for researchers and analysts across various fields. For those looking to delve deeper into data analysis and interpretation, Julius offers a platform that simplifies these processes. With intuitive tools and guidance, Julius can help users conduct and interpret one-sample t-tests, ensuring accurate and insightful results for their research or business needs.
