July 17th, 2024
How to Use R for Statistical Analysis
By Connor Martin · 16 min read

Statistical analysis in R is one of the most effective methods for researchers, analysts, and academics to draw insight from sets of data. But, for first-time users or those with little experience, statistical analysis in R can seem worryingly complex.
This guide breaks down how the R programming language works for statistical data analysis.
Understanding the Basics of Statistical Analysis
Before we dig into the details of the R language, let’s first provide a brief but clear look at what statistical analysis is.
In short, as the name might imply, stats analysis is the process of studying data – like facts and figures – to draw conclusions from it. It takes many forms and offers numerous benefits and outcomes. We can use statistical analysis, for instance, to test theories, predict future outcomes, or reach conclusions, all based on stats and datasets.
Understanding the Basics of R
Next, a quick look at the R language.
R is a programming language, designed by Ross Ihaka and Robert Gentleman back in the 1990s and developed specifically with statistics and data analysis in mind.
It’s almost like a statistical analysis toolbox in the form of a programming language, helping users sift through data, discover patterns, and make sense of stats. It’s free, open-source, and immensely effective in the right hands.
How R Can Help with Statistical Analysis
As touched on above, the R language was built from the ground up with stats in mind, so it has a lot of helpful tools and functions designed to analyze, read, and dig into stats and data.
Some of its advantages include:
- A Wealth of Features: R has many built-in statistical features and functions to help with the likes of calculations, medians, modes, and even advanced hypothesis testing.
- Data Handling: R also excels in terms of handling and cleaning up data. It can take a massive dataset and transform, condense, and tidy it, making it more manageable for analysis.
- Statistical Modeling: R supports the creation of various statistical models, helping users dive into and learn about the relationships and trends between variables and data points.
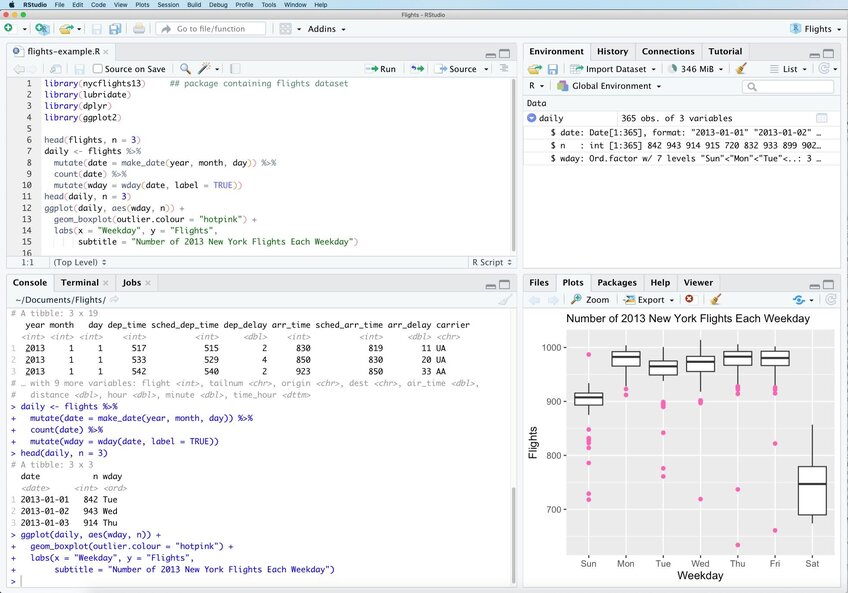
- Visualization: R is also a veritable visualization powerhouse. It can take data and convert it into easy-to-understand visual forms – charts, graphs, etc.
Statistical Analysis Methods in R
Some of the many tricks in the R language toolbox include statistical summaries, histograms, tables, scatter plots, one sample tests, and one sample median tests. Here’s a little more about each method:
Statistical Summaries
Using the “summary()” command, users can instantly carry out basic statistical analysis of their data. This command instantly calculates key metrics, like minimums, maximums, means, medians, and interquartile ranges of a set of numbers. It’s a huge time-saver.
Histograms
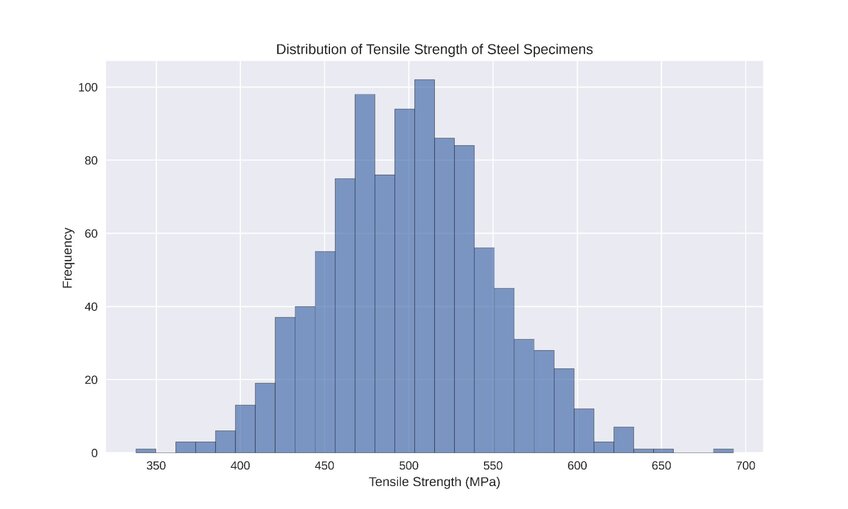
We’ve already talked about how R is particularly effective in data visualization, and histograms – graphs of frequency distributions – are a prime example of this. Using the “hist.default()” command, combined with the data you wish to visualize, R will plot your key data points in histogram form.

Tables
Another visualization method involves using R to create data tables. Again, this is effortless, once you know the right command. You can use “table()” and input your sample data between the parentheses to generate a table. The table will show all frequency distributions in a clear, easy-to-read format.
Scatter Plots
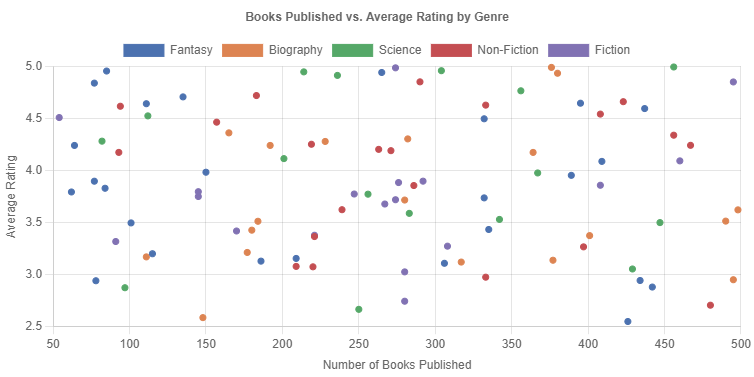
Let’s say you have two variables in a data set and want to carry out bivariate statistical analysis to see how the variables compare or contrast. A scatter plot/diagram is a terrific visualization method to do that, and R can do it all for you. Just use the “plot()” tool to generate a scatter plot instantaneously.
One Sample Tests
Another method of R statistical analysis is the one sample test, or one sample T-test. This tells you if your data’s mean is significantly different from an expected (hypothesized) value. It’s a little more complicated than the aforementioned methods, demanding a few specific steps:
1. Prepare your data in the form of an R object, like a numeric vector.
2. Specify your target mean.
3. Carry out a T-test using the “T-test(yourdata, mu=targetmean)” command.
4. Analyze the results and draw your conclusions.
One Sample Median Tests
Not to be confused with the above one sample T-test, the one sample median test aims to extract the median of your data, not the mean. Again, it involves a few steps:
1. Gather your data as an R vector or object.
2. Specify your target or hypothetical median.
3. Use the “wilcox.test(yourdata, mu=targetmean, alternative=”two.sided/less/greater”)” function.
4. Assess the results.

Pros and Cons of R for Statistical Analysis
Many statisticians consider R invaluable for statistical analysis, but it has a couple of drawbacks to counteract its advantages.
Pros
- Powerful Capabilities: With dozens of built-in functions, data manipulation, and analytical tools, R is a force to be reckoned with in the field of statistical analysis.
- Endless Functionality: There’s so much you can do with the R language, from importing and cleaning data to exploratory data analysis, visualization, and so on.
- Open-Source and Free: R is free to use and open-source, with no license costs or subscription fees. It’s accessible to all, from stats students to high-end research teams, with an active community of users and developers pushing the language to its limits.
Cons
- Complicated to Learn: Arguably the biggest downside of statistical analysis in R is the steep learning curve of the language itself. There are lots of codes and functions to learn, and you won’t be able to get much done without a strong knowledge of the language.
- Confusing Errors: R often produces confusing or unclear error messages when a code or function isn’t correct. This makes it difficult, particularly for new users, to figure out what’s gone wrong and how to fix it.
Use Julius to Combine R and AI to Make Statistical Analysis Easier
Overall, R is without a doubt a powerful, effective tool for basic statistical analysis and deeper dives into your data. But, for many, it’s very challenging to learn and even harder to master, so a lot of stats experts never quite manage to make the most of the R language.
Julius AI can help with that. It’s the most advanced AI data analyst, capable of reading, sorting, and drawing info from vast amounts of data in a fraction of the time it would take even a seasoned statistician. It’s even capable of using R’s many functions to help you learn more about your data, without having to know R by heart. Try it out today and take a deeper dive into your stats.
Frequently Asked Questions (FAQs)
What statistical test to use in R?
The choice of statistical test in R depends on your data and research question. For example, use a t-test for comparing means, chi-square tests for categorical data, or ANOVA for comparing means across multiple groups. R provides a wide array of tests, all accessible through built-in functions or packages like stats and car.
Why is R so good for statistics?
R excels in statistics because it was designed specifically for data analysis and statistical computing. It offers a vast library of built-in functions, packages for advanced modeling, and tools for data visualization, all while being free and open-source. Its adaptability and strong community support make it a favorite for statisticians and data scientists worldwide.
