How to run a One-way Analysis of Variance (ANOVA)
This article will provide a comprehensive review on using a one-way analysis of variance (ANOVA) to assess the success of three different diets on weight loss in individuals.
Introduction
One-way ANOVA is an invaluable tool in statistical analysis, frequently employed to compare the means of three or more groups to determine if there is a statistically significant difference among them. While the outcome of the ANOVA provides insight to the presence of significant differences, pinpointing where these differences are requires further examination through post-hoc tests, like pairwise multiple comparisons.
Before executing a one-way ANOVA, understanding the assumptions that allow for proper interpretation of the outcome must be examined. These assumptions are vital for the integrity of results of the one-way ANOVA. They are as follows:
1. Independence: Observations within each group must be independent of one another. This means that the values of one group do not influence the values in another group.
2. Interval or Ratio Variable: Your dependent variable must be measured as an interval or ratio (continuous) variable.
3. Two or More Groups: you should have two or more categorical independent groups.
4. Normality: The dependent variable (outcome measured) must be approximately normally distributed in each group.
5. Homogeneity of Variances (Homoscedasticity): The variances of the dependent variable should be approximately equal across all groups. In other words, the spread of data points around the mean should be similar across groups.
6. No Significant Outliers: If your dataset contains extreme outliers, this can reduce the validity of your results.
While the first three assumptions can be assessed based on the experimental design,
assumptions 4 through 6 need to be checked via statistical software. This use case will walk you through the steps in uploading a dataset, checking the assumptions of a one-way ANOVA, and interpreting those results in a clear and concise way.
Dataset Overview
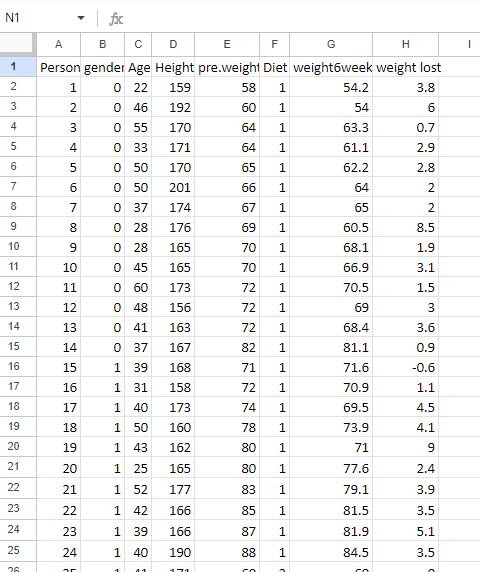
The dataset in this tutorial follows 78 individuals of various ages and genders who have been placed on one of three diets. Their weight was measured before implementation of the diet and then remeasured 6 weeks after being placed on the diet.
The goal of this tutorial is to determine which diet (categorical independent variable) is best for weight loss (continuous dependent variable) in individuals. A preview of the dataset can be found below, which shows the following columns: person, gender, age, height, pre.weight (before the diet), diet, weight 6 weeks (weight after 6 weeks), and weight lost (total weight lost). You can access this dataset here.
Step-by-Step Walkthrough
Step 1: Import your dataset into Julius
This walkthrough will be done using Python; however, you can also perform the analysis in Julius using R by switching the code runtime environment toggle in the top right of the chat interface.
To connect a dataset, you can either select the paperclip icon in the input bar to upload your data as a file, or you can also paste in a link to a publicly-shared Google Sheet. In this case, we are going to connect to a Google Sheet containing the diet and weight loss information.
Prompt: “Please preview the dataset from Google Sheets.”
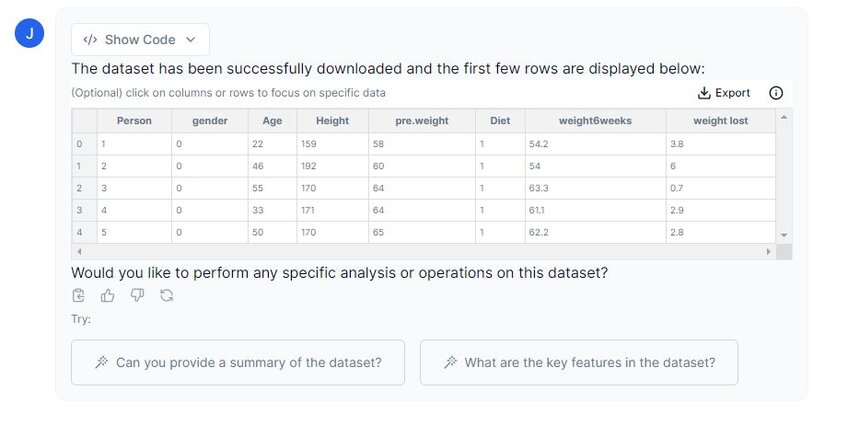
Above you can see that Julius has imported our dataset successfully. There are eight columns in total, but for this analysis, we will focus on the “weight lost” and the “Diet” columns. We will clean the dataset in the following step to accommodate this change.
Step 2: Cleaning Dataset
Let’s prompt Julius to create a new dataset called “adjusted_dietdataset”, where we have removed all the columns except for “Diet” and “weight lost”. Julius has a feature where we can highlight columns that we want to work with, so let’s try it out:
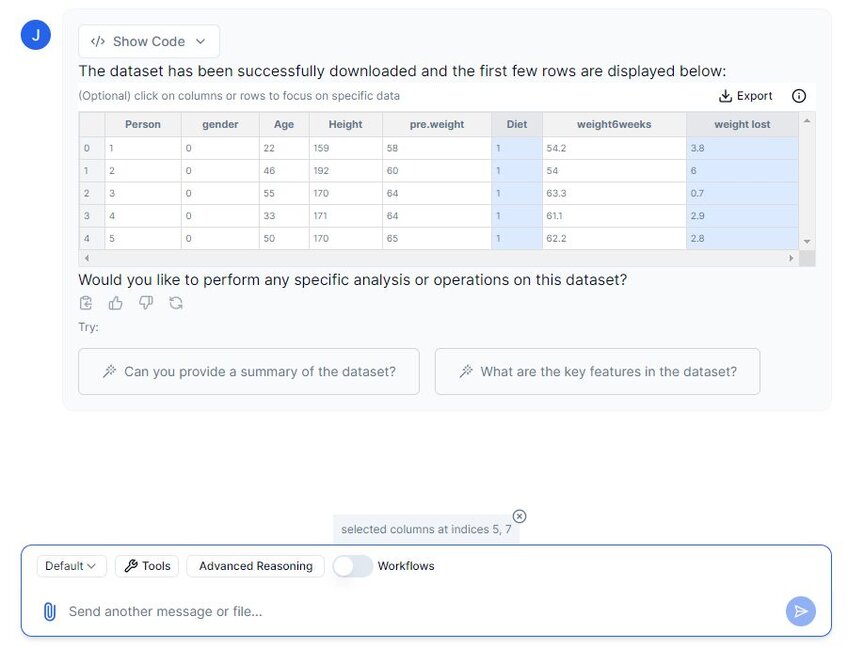
In the above image, I have selected columns 5 and 7, which are the columns we wish to keep. We can now prompt Julius to remove all other columns except for the highlighted ones.
Prompt 1: “Please create a new dataset named “adjusted_dietdataset” in which we only keep the highlighted columns.”
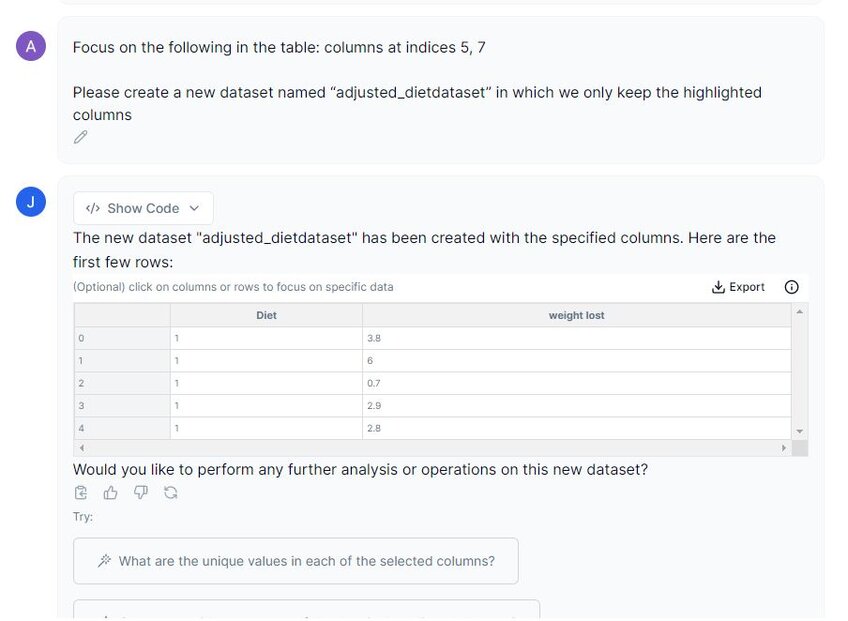
In the screenshot above, you can see that when I select the columns, a message displays: “Focus on the following in the table: columns at indices 5, 7”. This ensures that we have selected those columns.
We have successfully created a new dataset that only contains the columns we need. We should also rename the column headers to make it easier for Julius to read.
Prompt 2: “Please rename the column headers, with ‘Diet’ = ‘diet’ and ‘weight lost’ = ‘weight_lost’.”
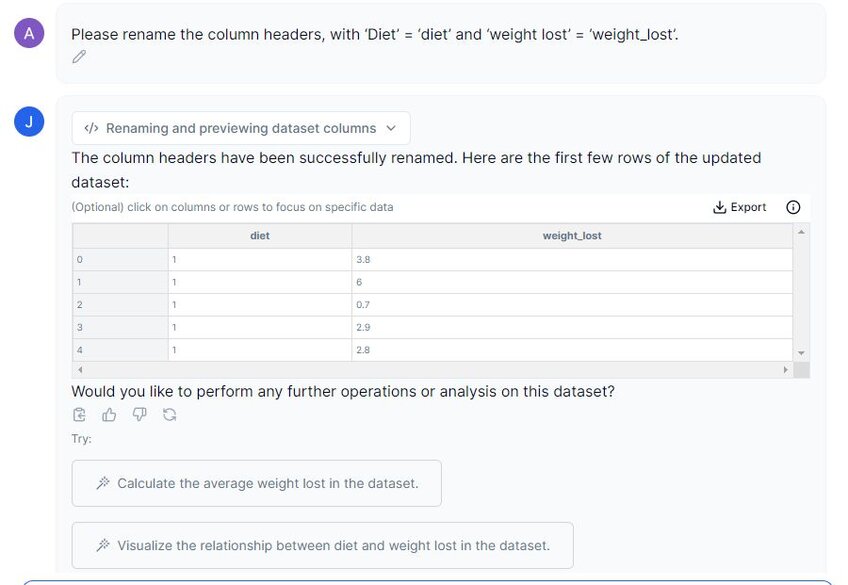
In the image above, we can see that the column headers have been renamed. We can now move on to descriptive statistics.
As an aside: I have visually inspected the dataset for any null entries, but considering that ‘0’ is a result, we cannot remove this entry as it will affect our dataset.
Step 3: Run Descriptive Statistics
Let’s prompt Julius to perform descriptive statistics on this dataset. We must specify that we want the descriptive statistics for each categorical independent variable (diet 1, 2 and 3). This will allow us to compare these groups.
Prompt: “Can we perform descriptive statistics on this dataset please? Break it down by diet.”
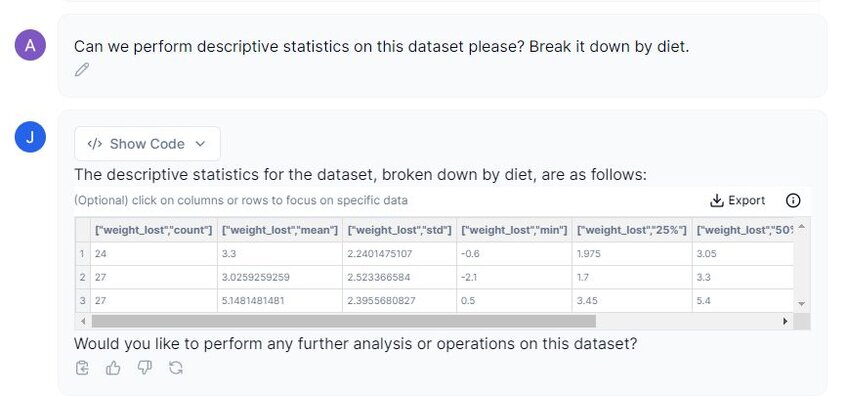
In the above screenshot, Julius has divided each diet type (labeled as 1, 2, and 3) and its corresponding weight_lost count, mean, standard deviation, minimum and maximum values, and the 25%, 50%, and 75% confidence intervals. If we examine the mean between all three treatments, we can get a general idea of how the diet affects weight loss efforts. We can see that both diet 1 and 2 have a mean around ~3, whereas diet 3 has a higher mean weight loss of 5.15 lbs (±SD 2.39).
Our next step is to check the assumptions to make sure that we can run a one-way ANOVA with this dataset.
Step 4: Testing Assumptions
a. Examining Normality
We can examine if our dataset follows a normal distribution by creating a histogram for each of the treatment types.
Prompt 1: “Please create histograms for each diet type so we can assess normality. Additionally, run a normality test.”


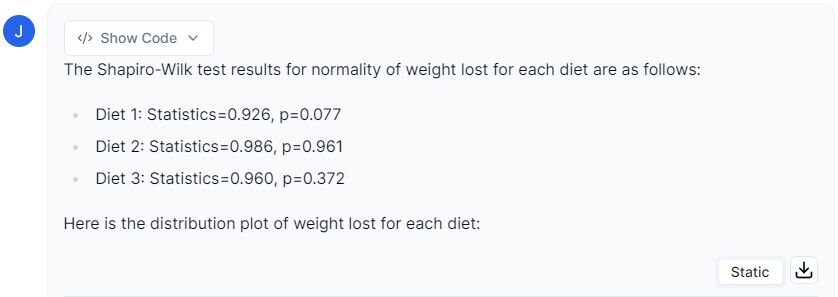
In the image above, we can see that all three of our diets follow a normal distribution, which can further be confirmed by the Shapiro-Wilk test results (p-values larger than 0.05). .
b. Examining Homogeneity of Variances
We can now examine the homogeneity of variances assumption. The common statistical test for this is Levene’s test, which will measure if there are equal variances across the three groups.
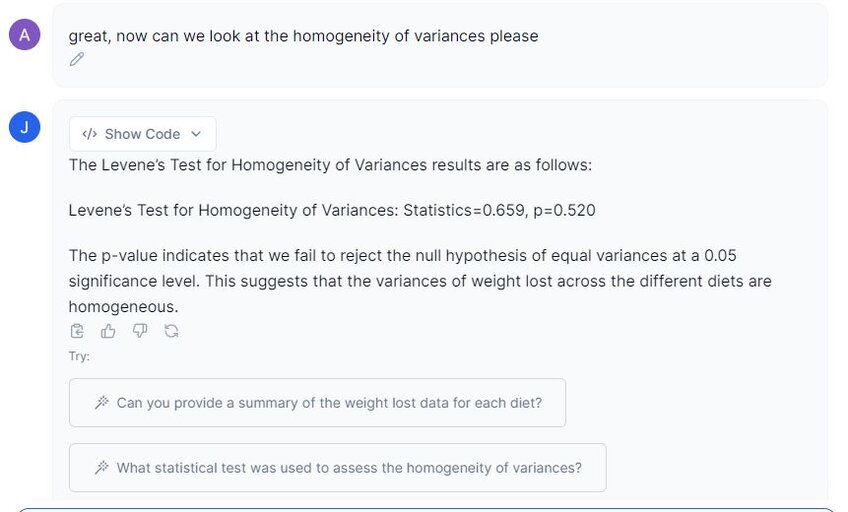
In the image above, Julius has given us a test statistic of 0.659, and an associated p-value of 0.520. This indicates that there is no difference between the variances in the population, and this assumption is passed.
c. Examining Outliers
Our final step is to determine if our dataset has any significant outliers. We can visualize any outliers using a box plot, or, we can have Julius identify significant outliers by creating a table on the extreme values it finds in each diet. Let’s start with the box plot to visually examine outliers.
Prompt 3: “Please create a boxplot on the three different diets and their corresponding weights. I would like to visualize any outliers.”


Examining the image above, we can see that there are two potential outliers in diet 1. However, considering that our dataset passes all assumptions, I do not believe that these will cause any potential problems.
There is a way for us to see how influential these outliers are by first running the one-way ANOVA with the outliers present and then without them and see if it influences the results. You can feel free to do this yourself to see how removal may impact your results, but to avoid introducing potential bias, I will leave them as is.
Step 5: Performing one-way ANOVA
We have checked all assumptions to make sure our dataset follows them, so our next step is to perform the one-way ANOVA.
Prompt 1: “Please perform a one-way ANOVA on the dataset.”
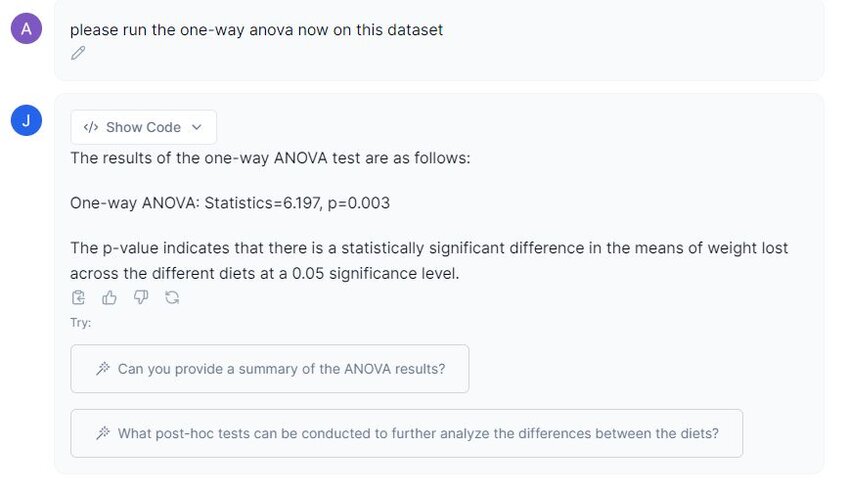
As we can see from the output generated above, our p-value is under 0.05, indicating that we reject the null hypothesis and there are statistically significant differences amongst the three diets in relation to weight loss.
Step 6: Post Hoc Analysis
As mentioned in the introduction, the one-way ANOVA only tells us if there are statistically significant results;, to identify where these significant results lie, we need to perform a post hoc test.
The name ‘post hoc’ refers to ‘occuring or done after the event’, which is fitting for this test as we perform it after the main analysis.
Prompt 1: “Please perform a post hoc analysis on the statistical significant results we obtained from the one-way ANOVA.”

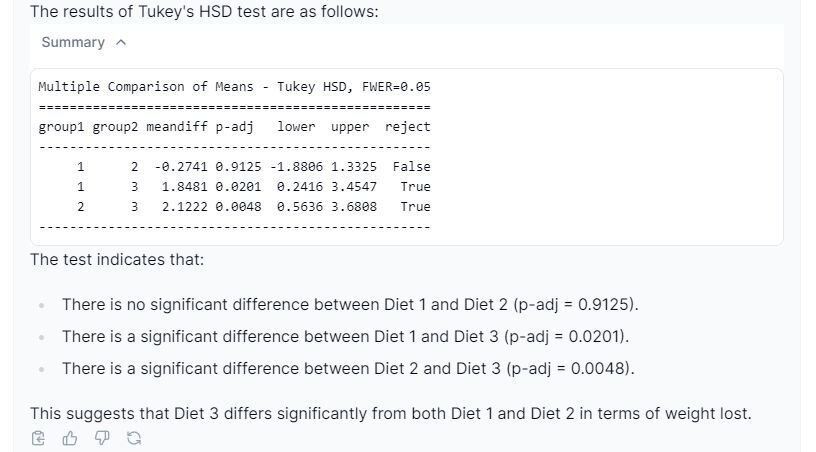
In the above screenshot, we can see that Julius has given us some common post hoc tests we can run on our dataset. It then chooses Tukey’s Honest Significant Difference (HSD) as the test of choice. If you are interested in why Julius choose the specific test, you can prompt it:
Prompt 2: “Why did you choose Tukey’s HSD over the other tests?”
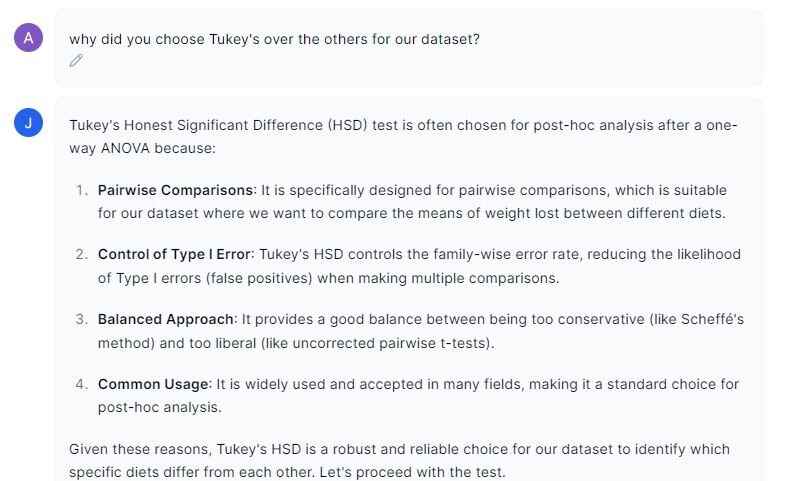
In the image above, Julius highlights why this post-hoc test was chosen over the others. Tukey’s HSD would have been my choice as it is considered the most balanced compared to the other options. Let’s turn our attention back to the results.

From the screenshot displayed above, we can see that Julius has run the required post hoc test. These tests compare the means of each group pairwise (hence the reason why it is labeled as ‘multiple comparisons’). The ‘meandiff’ column shows the mean difference between ‘group1’ and ‘group2’. For example, in the first row ‘group1’ is diet 1, while ‘group2’ is diet 2, with a mean difference of -0.2741.The ‘p-adj’ provides the p-value associated with the mean difference, indicating statistically significant.
The ‘reject’ column tells us if the null hypothesis (no difference between group means) is rejected. If the value is ‘False’, this means that there is no statistically significant difference between the means of the two groups; if ‘True’, there is a statistically significant difference.
From these results, we can conclude diets 1 and 3, as well as 2 and 3, show statistically significant differences.
Step 7: Visualization
Our final step is to create a visualization that best represents the statistically significant results we have obtained from both the one-way ANOVA and the post hoc tests. If you are unsure of what visualization should be used to convey your findings, you can always consult Julius. For this, I would like to create a bar graph with error bars
Prompt: “Please create a bar graph with standard error bars. Also include statistically significant brackets with asterisks denoting significance.”

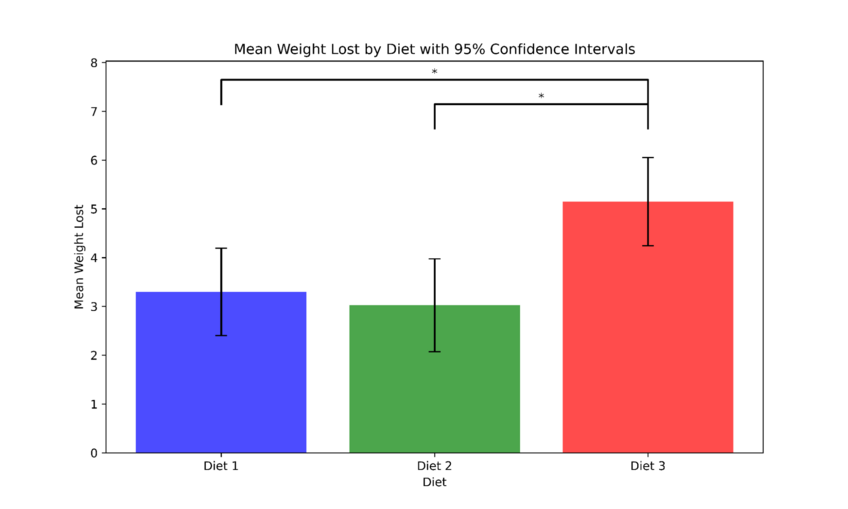
The figure above shows the mean weight loss for each diet. The asterisks (*) denote statistically significant differences between the diets based on pairwise comparisons. The figure indicates that diet 3 is significantly more effective at promoting weight loss in comparison to diets 1 and 2.
Step 8: Reporting Results
The final step to running any statistical analysis is to report your results. Below is an example of how you can report the findings in a results section:
“A one-way ANOVA was conducted to examine the effects of three different diets on weight loss success. The results of the one-way ANOVA indicated statistically significant differences in mean weight loss among the diets (F(2,75) = 6.197, p = 0.003).
To examine the statistical significance from these results, Tukey’s HSD pairwise comparison was run. The results revealed a significant difference between diets 1 and 3 (MD = 1.848, p = 0.020), and diets 2 and 3 (MD = 2.122, p = 0.0048). However, no significant difference was observed between diets 1 and 2 (MD = -0.274, p = 0.913).”
Conclusion
In this use case, we learned about the assumptions for a one-way ANOVA, how to test if our dataset meets these assumptions, how to perform the one-way ANOVA test and interpret its results, how to conduct post hoc tests, create visualizations to convey our findings, and report the results effectively.
With Julius, this complex process has become more manageable. Julius simplifies statistical analysis, helping us confidently tackle any task and create clear, attractive figures to showcase our findings. With Julius, data analysis is a breeze.
